Learn
- Share:
-

-

-

-

2024 Halftime in the Markets: What’s Up, What’s Down and What’s Next
By Chris Brown, CIMA®, CRPC™
Vice President — Investments
It’s hard to believe that we are just past the mid-point of the 2024 calendar year but time, as well as the U.S. markets, waits for no one. In this month’s market update, I wanted to provide the year-to-date drivers of the broad markets using the S&P 500 by sector, as well as theme-specific successes in the first half of the year. I will also address what the markets are indicating for the months ahead as we face another election year and possible sector rotations due to geopolitical implications.
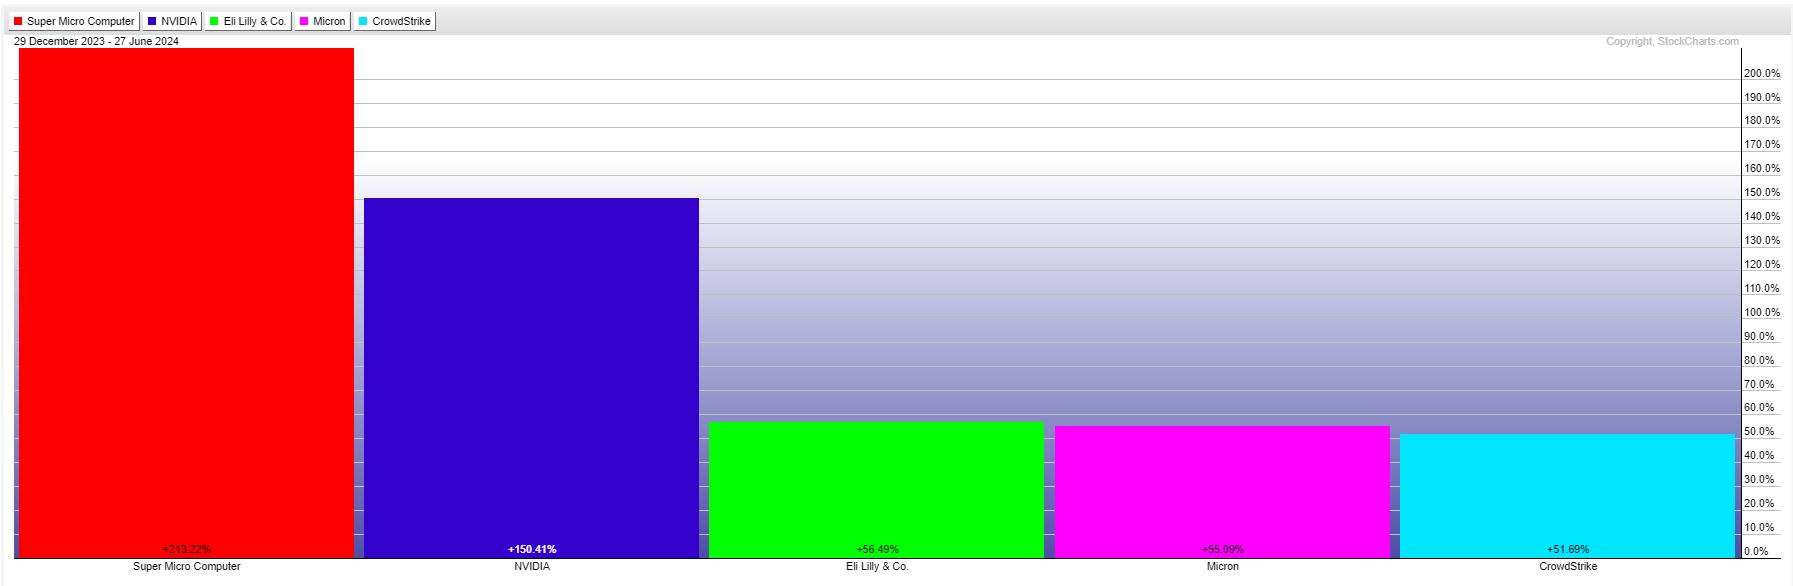
At the end of the second quarter of 2024, the S&P 500, the Dow Jones Industrial Average and NASDAQ composite indices were all positive year to date (YTD). The S&P 500 was up 16.5%, the Dow 4.6% and the NASDAQ 22.4% through the end of June, with the S&P 500 and NASDAQ both closing out the first half of the year at record highs. The massive disparity of the three indices has been led by two investment themes that, for the most part, reside within the S&P 500 and NASDAQ. These two themes are: artificial intelligence (AI) and GLP-1 drugs. AI leaders in the S&P 500 include companies like Super Micro Computers, Nvidia, Micron Technology and CrowdStrike, which have all returned more than 50% YTD with Super Micro Computers leading the charge at a whopping 208% YTD return followed by Nvidia up 150% YTD. As for the GLP-1 — used for diabetes and weight loss — drug companies making waves are Eli Lilly with Mounjaro and Zepbound, as well as Novo Nordisk with Ozempic, and Wegovy. This duopoly of the weight loss drug market has created a YTD return of 56% and 40% respectively. J.P. Morgan Research forecasts1 that the GLP-1 market will exceed $100 billion by 2030, and total GLP-1 users in the U.S. may number 30 million by the end of the decade — around 9 percent of the overall population.1
Top S&P 500 Stocks YTD
From Stocks to Sectors
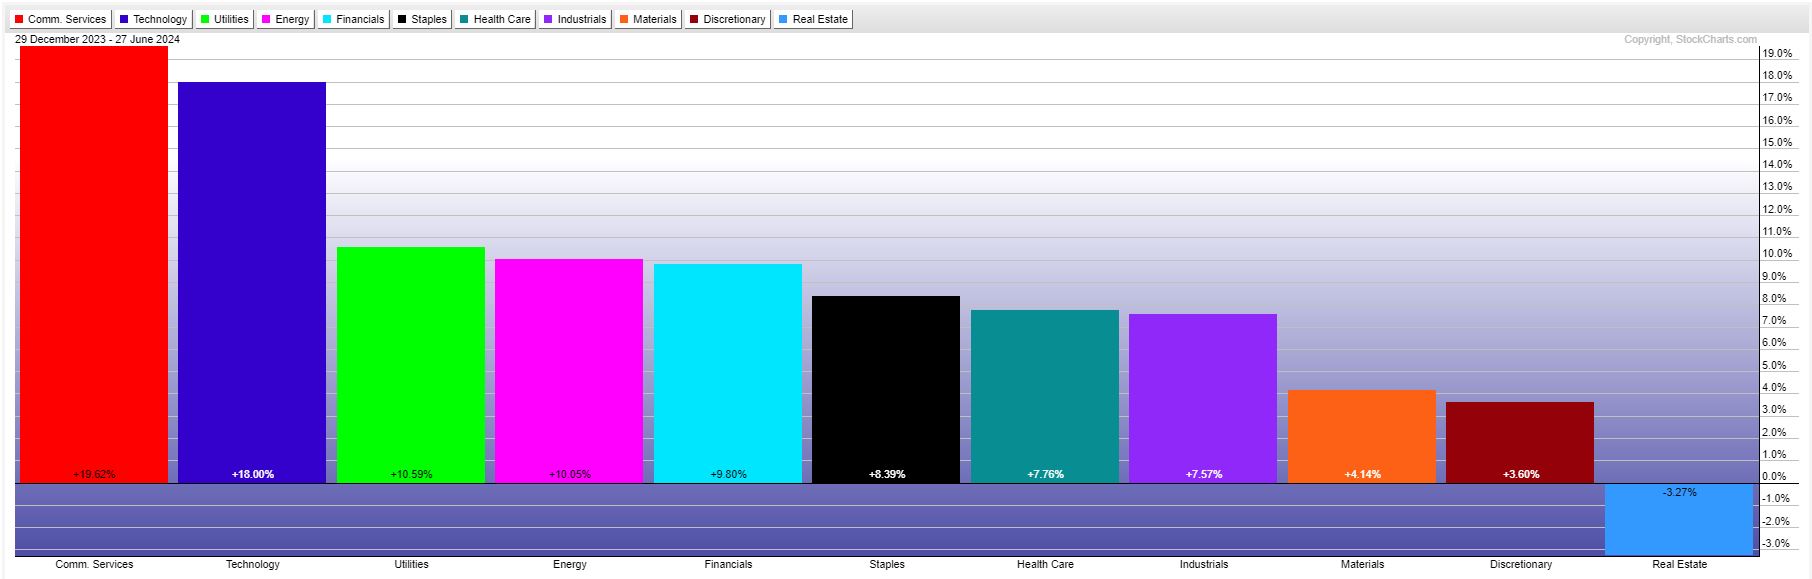
The 11 sectors of the S&P 500, the top performers YTD, are communication services and technology, followed by utilities and energy. Communication Services (Ticker: XLC) leads the 11 sectors at 19.6% YTD due to their heavy weightings in META, Google and Netflix, which represent 50% of the sector weighting and is responsible for the majority of the 19% return for the sector. Similar to communication services, the technology sector (Ticker: XLK) performance is being pulled forward by four companies that represent 50% of the technology index, which are Microsoft, Nvidia, Apple and Broadcom. One interesting sector that has been on the rise throughout Q2 2024 is the utilities sector (Ticker: XLU). Though this sector’s performance has been a bit lopsided, there has been a recent AI infrastructure trade happening among U.S. independent power producers (IPPs) that are speculated to benefit from the increased electric power demands of AI-powered data centers in the country. IPPs operate independently from the national power supply companies and have historically underperformed the broad utilities index. Steven Nguyen, head of Causeway Capital’s utilities and fundamental research, said, “The lower valuations for IPP utility firms offer multiple expansion opportunities in light of the rise of AI and data centers.”2
As data centers look to expand AI servers, they may need between 100 to 150 megawatts of power, which is comparable to the energy consumption of a medium-sized city. Experts say that this AI power consumption need could double by 2030. Companies like Vistra Energy, Constellation Energy and NRG Energy are up YTD 127%, 74% and 53%, respectively.
S&P Sector Performance YTD
Earnings Growth Looking Forward
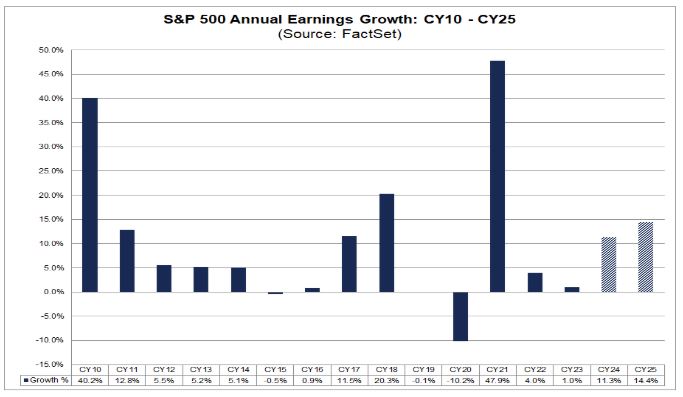
For Q2 2024, the estimated earnings growth rate for the S&P 500 is 8.8% on a Year-over-Year (YoY) basis. If estimates are correct, this will mark the highest YoY growth rate reported since Q1 2022, at 9.4%. John Butters, FactSet vice president and senior earnings analyst, said, “Industry analysts in aggregate predict the S&P 500 will report Year-over-Year earnings growth of 11.3% for calendar year 2024 and 14.4% in 2025”.3
The last time the S&P 500 reported double-digit earnings growth was 2017 and 2018. Although earnings growth is a positive catalyst for the markets — like 2017 when the S&P 500 returned 21.8% — this heated market condition can cool off quick, similar to the fourth quarter correction of 2018 when Federal Reserve Chair Jerome Powell announced a continuation of rate hikes for the year; the S&P 500 corrected 18% from October through the end of 2023, resulting in a 4.8% loss for the calendar year. As earnings expansion continues, the markets are finding solid footing in various sectors even though the Fed has not started any of the anticipated six rate cuts that were projected on the Fed dot plots in December. It’s almost hard to believe that growth stocks are up above 10% for the first half of the year with no assisted monetary easing by the Fed. High-quality U.S. large cap companies may have enough gas left in the tank to further this mid-cycle business market for next several quarters. I do anticipate seasonal corrections in the markets coming into the third and fourth quarters but not any more than the garden variety 6% to 10% correction, which may create more of a buying opportunity than another 2022 earnings recession.
S&P 500 Earnings Looking Forward
Risks Ahead
As we look forward to the second half of the year, let’s address a couple risk points for the U.S. economy. The first is slight uptick in U.S. unemployment. We had a low point in the monthly unemployment reading for April 2023, at 3.4%. As of the last report in June for this past May, unemployment numbers were at 4%. If unemployment climbs above 4.25%, we may see a slowdown in U.S. consumer spending, which comprises two-thirds of U.S. Gross Domestic Product (GDP). This may force a Fed rate cut prior to the anticipated months of either November or December. The Fed will pay close attention to the upcoming unemployment data since it affects one of the two mandates that the Fed is responsible for maintaining, unemployment and price stabilization.
The second risk for the second half of the year will be U.S. Treasury rates. As I wrote in my May 2024 Synovus Market Update, the U.S. dollar and U.S. Treasury yields had both climbed through April and peaked in that month’s third week. Coincidentally, that was the same point that the S&P 500, Dow Jones, and Nasdaq all pulled back between 4%-7% on all three indices, when Treasury rates started to fall in May and in June the equity markets rebounded, continuing their bull market run with the S&P moving up 10% and the Nasdaq going up 16% off the April 19 lows. The continuation of the negative correlation between U.S. Treasury yields and U.S. dollar versus the equity markets may persist further, so paying attention to the Treasury yields on the five year, 10 year and 30 year could possibly provide some insight in the direction of stock market.
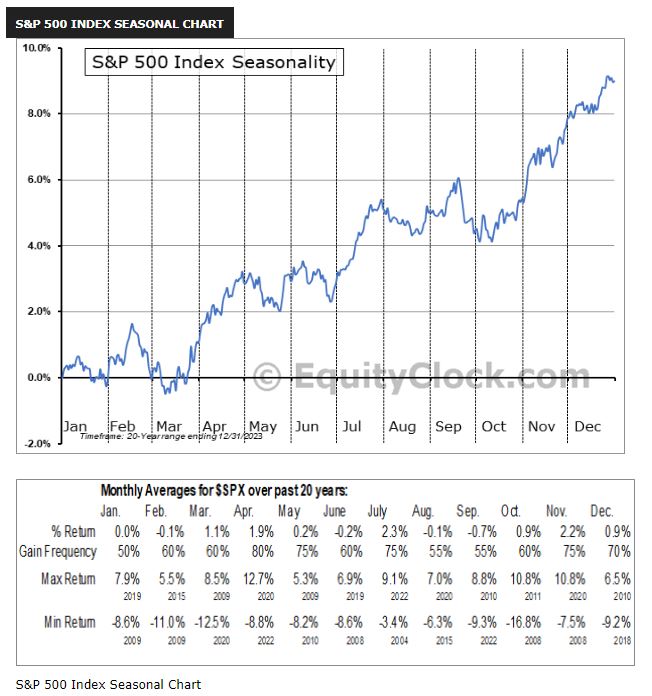
The last risk that we could see for the second half of the year is seasonality risk. The graphic below shows a 20-year chart of the S&P 500, illustrating monthly average returns from 2003 to the end of that year. The percentage of positive versus negative returns reduced by 20%, between August and October with the gain frequency for the S&P 500 reduced to 55% compared to 75% between November and December. A near-term presidential election will be looming for the beginning of November. This could play a role in short-term volatility based on which party will win the presidency. Remember that corporate earnings will be key as well as the continued direction of inflation. If we can maintain our downward trend for inflation, maintain continued corporate earnings growth and labor markets stay intact, then we could finish the year at slightly higher price levels.
S&P Seasonality Chart
Important disclosure information
Asset allocation and diversifications do not ensure against loss. This content is general in nature and does not constitute legal, tax, accounting, financial or investment advice. You are encouraged to consult with competent legal, tax, accounting, financial or investment professionals based on your specific circumstances. We do not make any warranties as to accuracy or completeness of this information, do not endorse any third-party companies, products, or services described here, and take no liability for your use of this information.