Learn
Macro Vibes — Short-Term Pain for Long-Term Gain
Christopher Brown, Vice President
Investments, Synovus Securities, Inc.
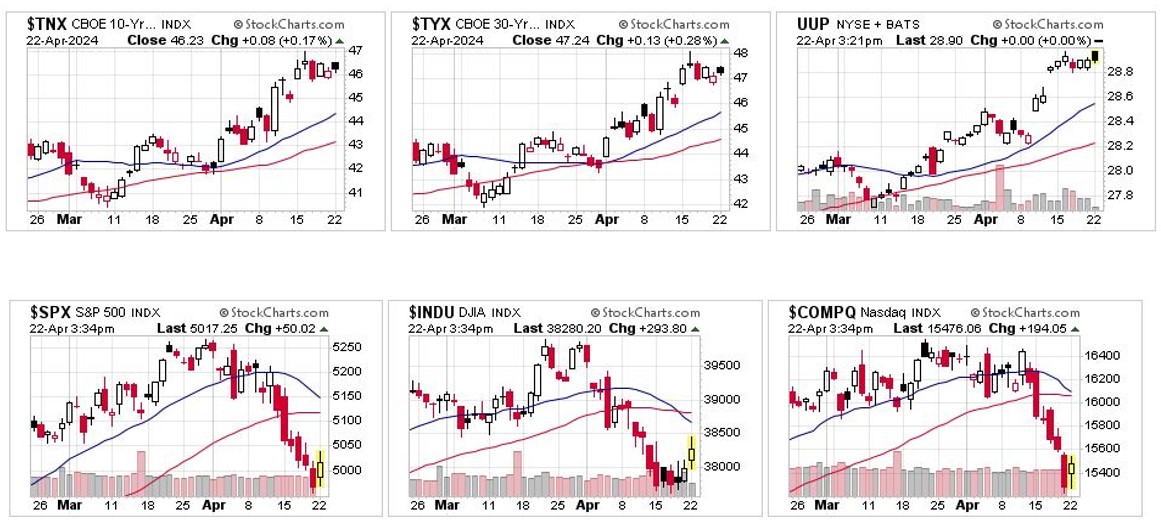
As we enter earnings season for Q1 2024, we have seen our first signs of market turbulence since the Q3 2023 lows. During this time the S&P 500 corrected nearly 10% from August to the end of October 2023. There are a few near-term indicators that have shown some of the causation of the recent volatility. One is the rapidly rising 10-year and 30-year treasury rates, and the second is the rise of the U.S. dollar. Since the end of Q1 2024, the 30-year Treasury yield has moved up from 4.35% to 4.78%; the 10-year Treasury yield has increased from 4.20% to 4.65%; and the U.S. Dollar index (DXY — Dollar vs. Yen index) has moved from 104.4 to 105.7. You may notice in the chart below that when these three indices moved upward the S&P 500, Dow Jones Industrial Average and NASDAQ started correcting. This is what is called inverse correlation.

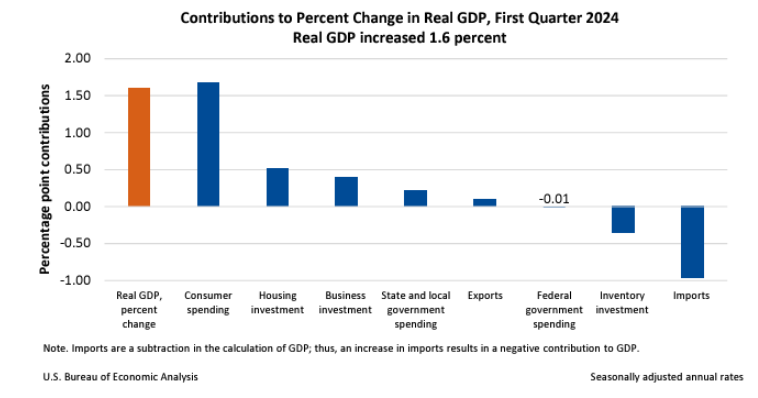
Going forward, the Q1 2024 earnings — along with the Gross Domestic Product (GDP) quarter-over-quarter report — will be two drivers that may determine the near-term future performance of the markets. As of April 25, Q1 2024 real GDP growth came in at 1.6%, which was much lower than the Atlanta GDPNow estimate of 2.7%. This lower-than-anticipated number came by the way of weakness in net exports that scraped away a little more than 1.9% of GDP. Net exports are one of the most volatile data points of GDP. When looking at “Core GDP,” which is made up of consumption and fixed investment, that grew by 3.1%, a strong economic print. The Federal Reserve uses a core component of GDP called the Price Consumption Expenditures (PCE) as a key indicator to measure inflation and determine future monetary policy.
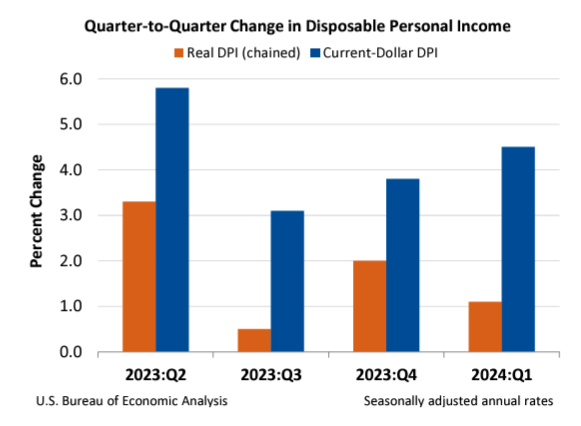
Ultimately, PCE measures the U.S. consumer’s spending on goods and services. PCE increased 3.4% in Q1 2024, higher than the anticipated 2.9%. Interestingly enough, the Atlanta Fed estimated Q1 2024 PCE to be 3.6%, which was much closer than the market forecast. Further data was published for U.S. personal income and savings in the Real Disposable Personal Income (DPI). DPI measures personal disposable income (adjusted for taxes and inflation) or what the average paycheck that is left over after all household expenses paid. According to the Bureau of Economic Analysis (BEA), DPI grew by 1.1%.

What does all this data mean? This data points to one common denominator — the U.S. consumer is flush with spending power. There is an argument to be made that higher rates during the past 24 month have been stimulative to those economic participants (business and personal) that have cash assets and equity investments. Why is this important? As indicated in my March Market Update, GDP growth is heavily weighted on the health of the U.S. consumer, which comprises of almost 70% of U.S. GDP growth. If the U.S. consumer is healthy, then there is an extremely good chance the GDP growth will persist. If the pre-existing abundance of household disposable income is still growing and the labor markets remain tight, this would signal that U.S. consumers will continue to spend, and inflation may remain sticky — in the low 3% range — for an uncertain period. This thesis points to a “higher-for-longer” interest rate policy and the “no landing” scenario when it comes to future Fed funds rate cuts.
Chart 3- Disposable Income Growth from BEA- https://www.bea.gov/

Q1 Earnings
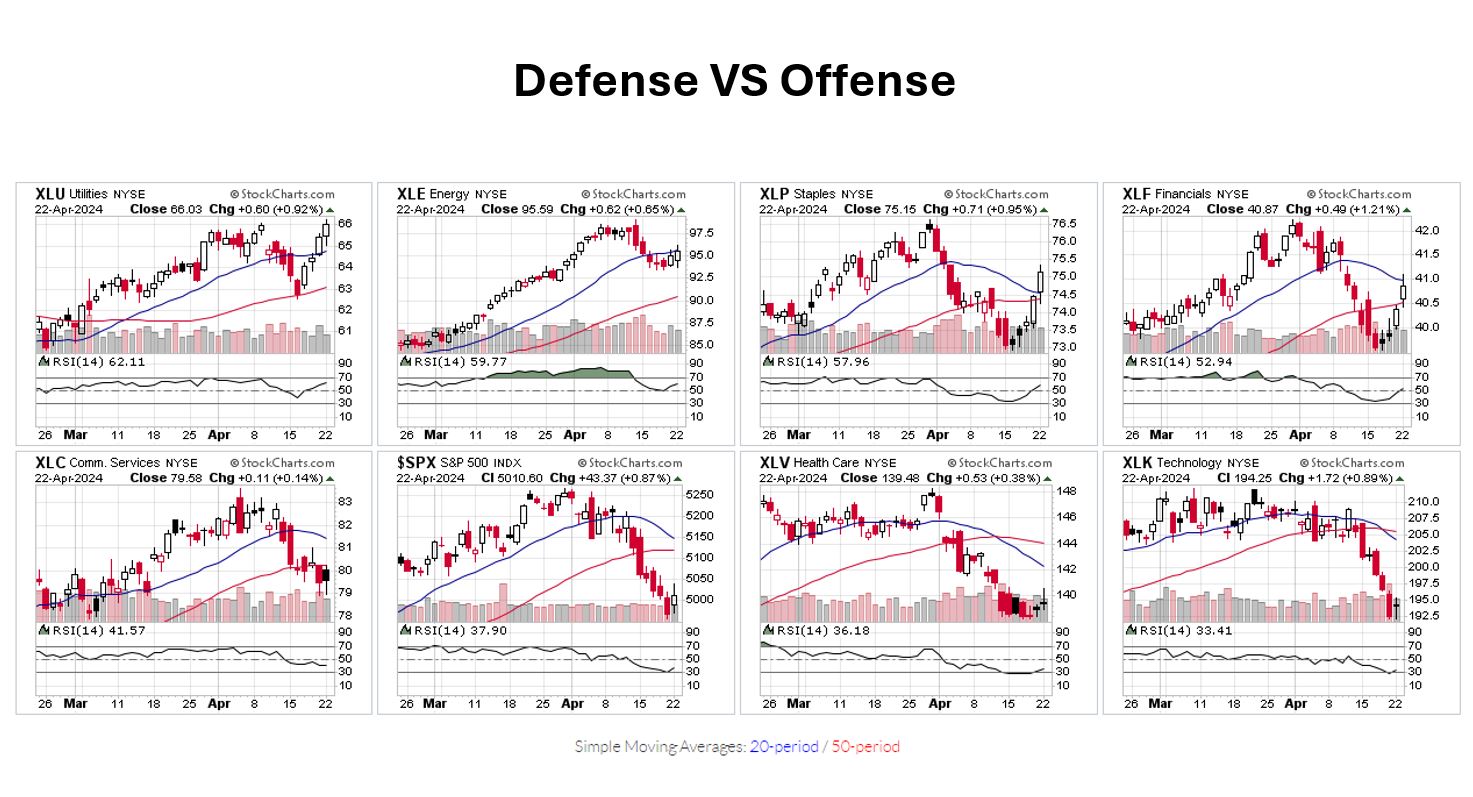
Approximately half of the S&P companies will have reported Q1 earnings as of the last week of April. “The estimated growth rate for the S&P 500 is 0.50% for Q1 2024. This would mark the third consecutive quarter of Year-over-Year (YoY) earnings growth. The Q1 2024 earnings growth estimate for the S&P 500 is 3.5% and would mark the 14 consecutive quarter for earnings growth for the index,” according to FactSet Vice President and Senior Earnings Analyst John Butters. Q1 earnings estimates have shown a broadening of earnings growth for S&P companies beyond the “Magnificent 7,” the mega-cap growth companies that dominated the returns for the S&P 500 in 2023. This growth rotation is healthy for the markets and may provide further indications that the current secular bull market can continue broaden to further non-technology sectors throughout the rest of the year. The rotation of the current investment landscape from offense to defense is starting to show through the chart below. Defensive sectors are revered as low-volatility, dividend-paying companies. These sectors include Utilities (XLU), energy (XLE), consumer staples (XLP) and financials (XLF). In contrast, the offensive “risk-on” sectors include communication services (XLC), technology (XLK), healthcare (XLV) and consumer discretionary (XLY).

In my analysis, I feel the 11 sectors of the S&P 500 participate in their own rhythmic waltz moving from risk-on to risk-off, offensive to defensive, while the tempo and rhythm of the music can fade and change without warning. Owning allocations in offensive and defensive sectors allow for allocation adjustments to smooth out the short-term volatility of the equity markets. This is why diversification could be a great investment strategy for many long-term investors. How nerve-racking would it be to have all your money in one or two stocks, sweating in front of your computer monitor with your finger hovering over a sell button? For the sake of your personal and financial health, it’s best to create a purposeful plan that is diversified and attuned to fit your time horizon and overall risk tolerance. A well-defined financial and investment plan can provide you the peace of mind when market volatility sways the tempo of the markets and the bears come out to dance.
Important disclosure information
Asset allocation and diversifications do not ensure against loss. This content is general in nature and does not constitute legal, tax, accounting, financial or investment advice. You are encouraged to consult with competent legal, tax, accounting, financial or investment professionals based on your specific circumstances. We do not make any warranties as to accuracy or completeness of this information, do not endorse any third-party companies, products, or services described here, and take no liability for your use of this information.

