Learn
Earnings Season, The Dollar, Rates and Market Volatility
By Chris Brown, CIMA®, CRPC™
Vice President — Investments, Synovus Securities, Inc.
Q3 Earnings
For the end of October approximately 50% of Q3 earnings have uncovered a mix of positive surprises on top- and bottom-line numbers. Many of the positive reported earnings are above their 10-year averages. According to FactSet Vice President, Senior Earnings Analyst John Butters, “Of these companies that have reported, 78% have reported actual earnings per share (EPS) above estimates. In aggregate, companies are reporting earnings that are 7.7% above their estimates. Eight of the 11 sectors are reporting [year-over-year (YoY)] earnings growth led by Consumer Discretionary, Communication Services and Financial sectors while Energy, Materials and Healthcare are reporting YoY declines in earnings.”
Below are the eleven sectors of the S&P 500 and their earnings growth on a YoY basis at the midpoint of the Q3 earnings season.

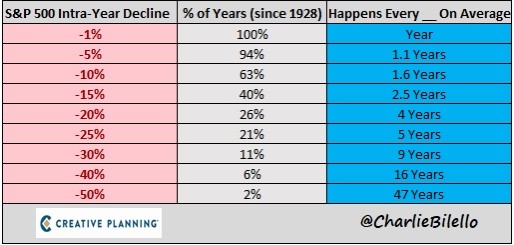
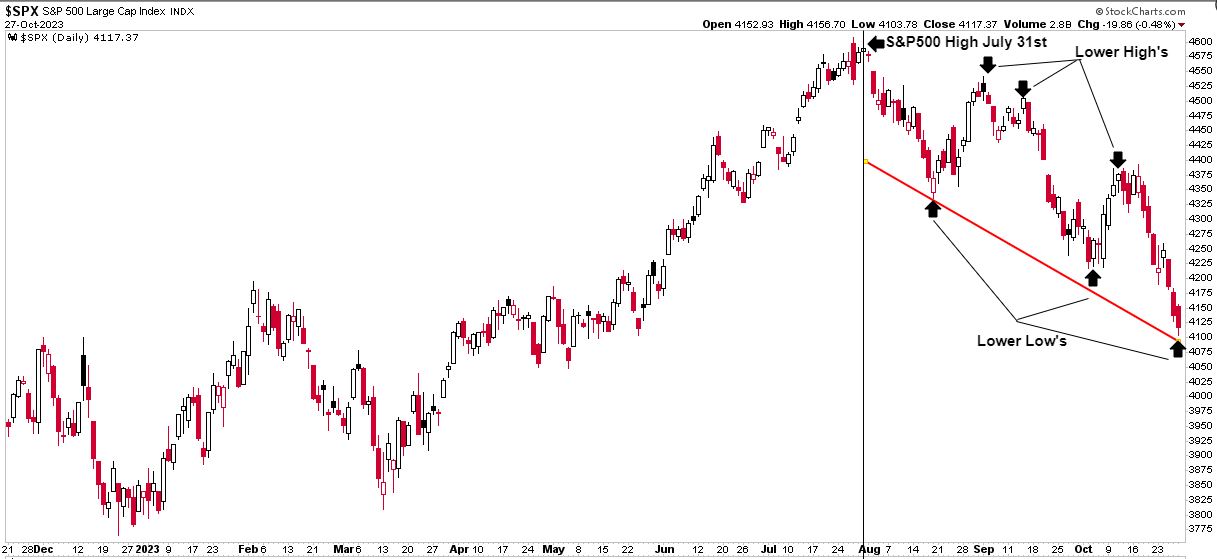
As of October 27, the S&P 500 forward price-to-earnings (P/E) ratio was 17, below the five-year 18.7 average and below the 10-year 17.5 average. The S&P 500 has had a positive year-to-date return of 7.67%, as of market close on October 27, and a one-year 8.14% return. The recent slide since the July 31 high was approximately -10%. Though this feels a bit like a heavy correction, historically the S&P 500 index tends to have annual corrections of approximately -10% every 1.6 years based on charts presented by Creative Planning’s Chief Market Strategist Charlie Bilello.
If earnings growth, consumer demand and low unemployment seem to be fairly healthy, then why does the market feel so dreadful?
U.S. Dollar Index
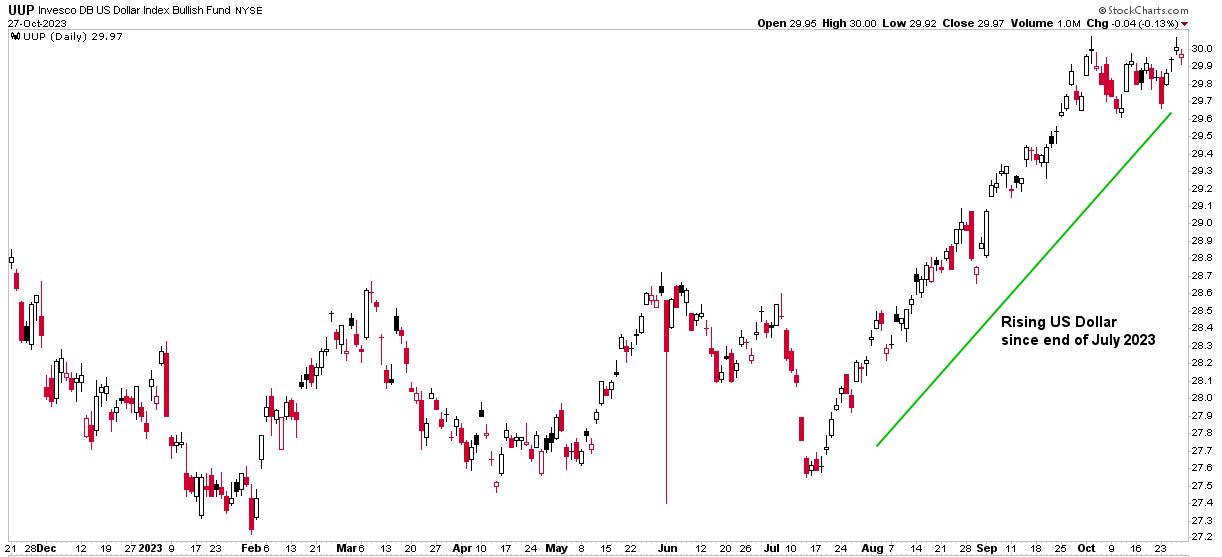
Since the end of July the U.S. dollar has risen against other major world currencies, by 6.25%. Ticker symbol UUP is the Invesco U.S. Dollar index and tracks the changes relative to a basket of world currencies. Ever since this turn in dollar strength, the S&P 500 has been in a choppy decline. Illustrated in the charts below, you can see an opposite trend from the rising U.S. dollar and the weakness in the S&P 500.
Interest Rates
Since its last rate hike of .25% at the end of July, the Federal Reserve has kept the federal rate unchanged. Keep in mind that the Federal Reserve rate hikes primarily affect shorter-term interest rates directly, two years and less. U.S. Treasuries with maturities longer than two years can have some directional correlation with Fed rate hikes, but is primarily driven by supply and demand in the bond market.
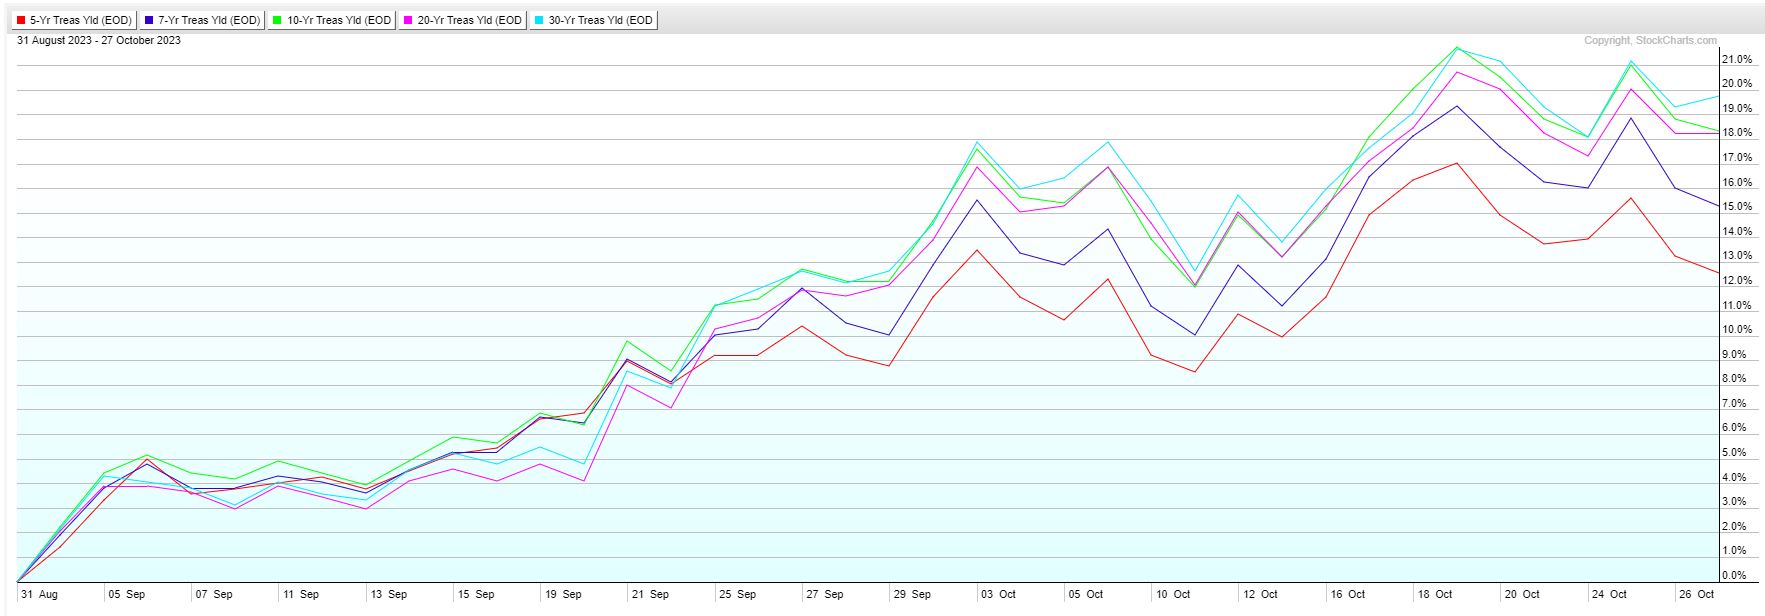
Since short-term Treasury Bill (T-Bill) rates have approached the mid 5% range, it seems that the market is demanding a higher interest rate in order to buy and hold longer-term U.S. Treasury debt. If I can buy a one-year T-Bill over 5%, why would I want a 10-year T-Bill at 4%?! This demand has created a rapid increase in interest rates since the end of August. The percentage change of the five-, seven-, 10-, 20- and 30-year treasury rates is above 12% for the five year and more than an 18% increase in rates for 10-, 20-, and 30-year rates. The 10-year treasury rate has moved from 4.09% at the end of August to 5% on October 19 until dropping to 4.84% on October 27. This marked the highest 10-year treasury rate since July of 2007. The 30-year U.S. Treasury rate is currently at 5.03%, moving 75 basis points (BPS) higher over the past 60 days. The Dow Jones Industrial Average and S&P 500 tend to decline during times of rapid rising interest rates. We witnessed this in 2022 when short-term rates moved from .65% to 4.65% (see chart below).
Where Do We Go From Here?
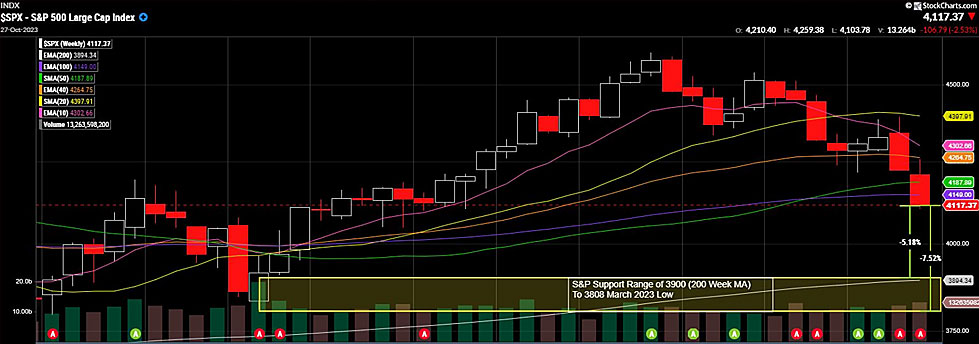
The markets are entering a time of the year when we tend to see a year-end rally, but factors such as the U.S. dollar and rapidly rising longer-term rates have taken some bullish sentiment away from investors. Since October 25, the S&P 500 has moved below a 4,200 key level and was at 4,117 as of October 28. We may see a short-term bounce from these levels, but the current market trend was down. If the S&P 500 remains in a downtrend, some of the near-term levels of support would be the 200-week moving average, which was approximately at 3,900. The second level of technical support would be the March 13 closing low at 3,808 based on the S&P 500 weekly chart below.
We will continue to pay close attention to the second half of earnings reports. The Federal Reserve met on November 2, and based on the market consensus it continued to hold the Fed rate at its current 5.25% to 5.5%. It’s interpreted as a positive since the Federal Reserve rate hike mission has not presented an added element of risk for 2023. Though we have seen four rate increases this year, the message has been relatively telegraphed. The rate of change has been much more palatable for the markets at 25 BPS than the four 75 BPS rate increases in 2022. Creating a long-term financial plan to endure the volatility of the markets can be a great strategy to remain invested during these choppy market conditions.
Understanding your risk tolerance and time horizon will help you develop a plan to remain invested while taking advantage of the opportunities that the market presents during uncertain times. In closing, financial professionals can provide context around your financial goals and create an investment portfolio that helps you weather the choppy seas of market uncertainty.
Important Disclosure Information
This content is general in nature and does not constitute legal, tax, accounting, financial or investment advice. You are encouraged to consult with competent legal, tax, accounting, financial or investment professionals based on your specific circumstances. We do not make any warranties as to accuracy or completeness of this information, do not endorse any third-party companies, products, or services described here, and take no liability for your use of this information. Diversification does not ensure against loss.

