Learn
A Bull Market … Technically
With the back end of summer upon us, we experienced a recent heat wave that spread across the U.S. You could say the same about the U.S. equity markets catching a similar heat wave over the past few months. Expanding market breadth and upward trends in the broad U.S. equity markets (i.e., S&P 500, Dow Jones and NASDAQ) — coupled with low unemployment, better-than-expected corporate earnings and a resilient U.S. consumer (consumption represents approximately 70% of Gross Domestic Product (GDP)) — have many investors and market prognosticators hoping for a soft landing for the U.S. economy in the second half of 2023 through 2024’s first half. In July’s Market Update, I had addressed the widening participation of U.S. stocks beyond the “Magnificent Seven” and a broadening stock participation in this year’s rally would provide a healthier and more sustainable bull market for 2023. As of July 28, the year-to-date (YTD) return of the S&P 500 is up 19%, the NASDAQ improved by 36% and the Dow Jones Industrial Average (INDU) is also up 7%.
In this month’s market update, there have been some technical aspects of the U.S. equity markets that have signaled a possible continuation for the bull rally throughout the remainder of the year. One of the oldest and still widely used technical indicators recently displayed a confirming bullish signal for INDU and the Dow Jones Transportation Average (TRAN).
What is Dow Theory?
Dow Theory, developed by Charles Dow, is one of the oldest and most influential market theories in technical analysis. Dow, also known as the co-founder of Dow Jones & Company in 1882 and the Wall Street Journal in 1889, theorized that market trends followed certain tenets and operated in three phases: 1. Accumulation Phase; 2. Public Participation Phase; and 3. The Excess Phase. Dow’s writings have been used to help investors make informed decisions on stock prices and price trends for more than 100 years.
The core principle of Dow Theory is that market price movements reflect all available information also known as the efficient market hypothesis (EMH). By carefully analyzing these movements, investors can identify the underlying market trends based on the psychological behavior of buyers and sellers in the market. Dow Theory consists of six basic tenets, but we'll focus on the three primary technical market signals for a bull market in the U.S. stock market.
- The Dow Theory Bull Market Confirmation: The first signal indicating a bull market is a series of higher highs and higher lows in both the $INDU and the $TRAN. When the $INDU reaches a new high and shortly afterward the TRANS also establishes a new high, it suggests that economic activity is picking up. This intermarket confirmation is a positive sign for the overall stock market.
- The Dow Theory Follow-Through Confirmation: The second signal involves a follow-through confirmation in the INDU and the TRANS. This occurs when, after the initial higher highs and higher lows, there is a minor decline (10-15%) in stock prices. However, if both indices recover and resume their upward trajectory, surpassing their previous highs, indicates a strong bull market.
- The Dow Theory Volume Confirmation: The third signal in a bull market is the confirmation of increasing trading volumes. As the market rallies and prices surge, higher trading volumes should accompany the upward movement. This volume surge suggests increasing investor confidence and participation, solidifying the sustainability of the bull market.
On July 28, the Dow Jones snapped a 13 consecutive day winning streak, its longest series of daily positive closes in 36 years. The Dow’s longest ever winning streak was 14 sessions, set in 1897, according to the S&P Dow Jones Indices.
“Following a nine-day winning streak on the [$INDU] (or in our case 13-day streak), forward returns [have] historically been above average, with relatively high positivity rates,” according to Adam Turnquist at LPL research.
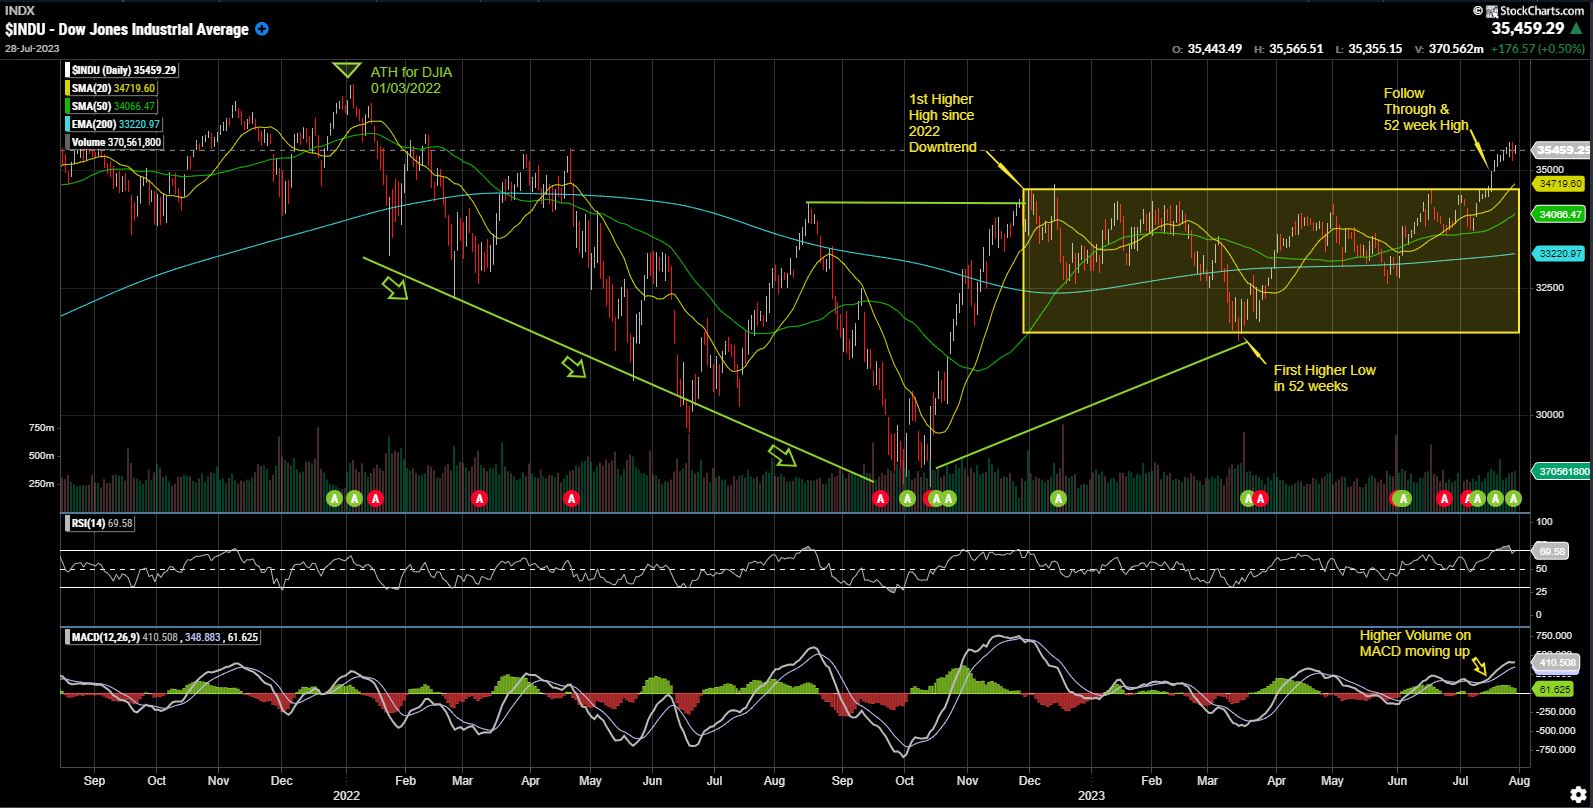
Chart one shows the INDU breaking out initially from its 2022 downtrend last November 30, making its first higher high, breaking the last peak on August 16 last year. The INDU consolidated with sideways price action for the first half of this year (yellow shaded box) but never broke down below the last “low” of October 2022. The follow through breakout on July 17 — and finally higher volume — was confirmed as the moving average convergence/divergence (MACD) showed above-average volume and momentum starting the week of July 17.
Chart 1

Source: StockCharts.com
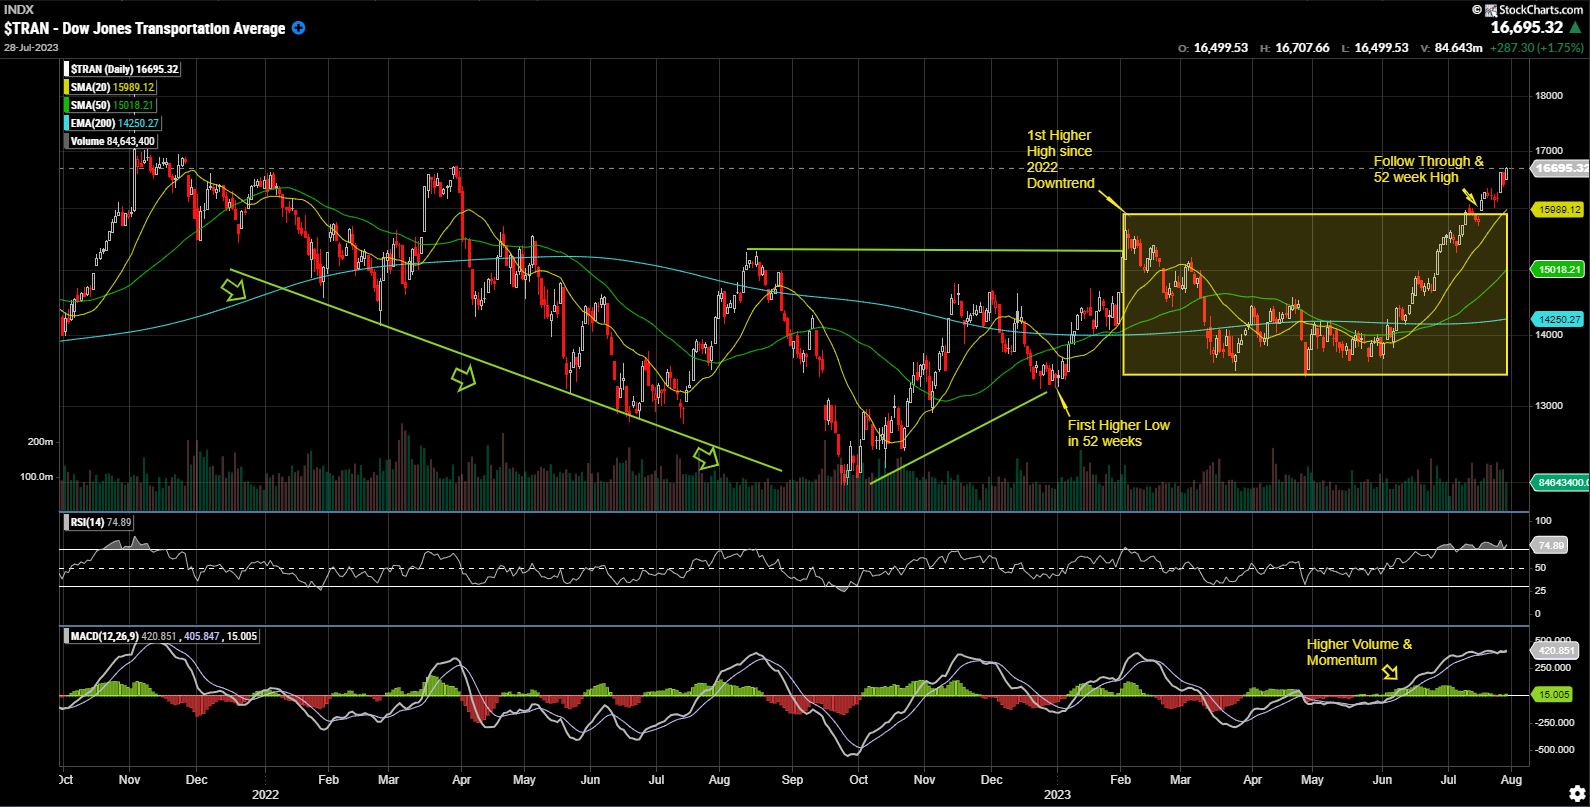
Chart two shows the confirmation of the $TRAN chart validating all three tenets listed above. Both indices breaking out of their consolidation (sideways movement) pattern confirms the Dow Theory Bull Signal just days from each respective price breakout as well as both $INDU and $TRAN climbing on higher momentum and volume based on the MACD (Bottom of chart 2).
Chart 2

Source: StockCharts.com
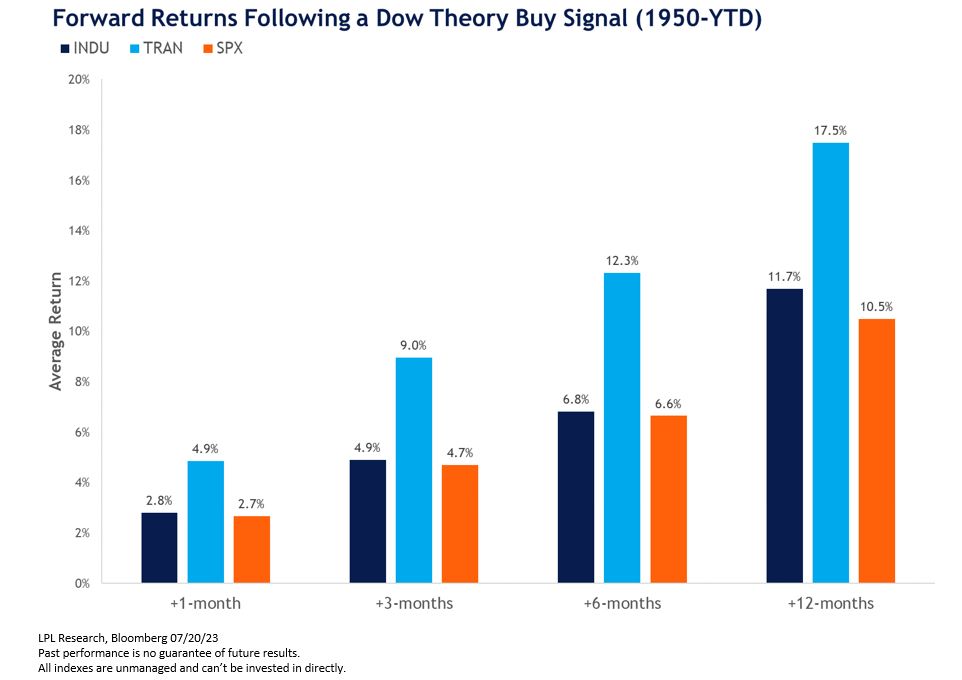
“Given the recent breakouts on both indexes, a Dow Theory buy signal has now been triggered, adding to the evidence that the primary trend for the broader market is higher,” says Turnquist. “Furthermore, we back-tested buy signals based on overlapping breakouts to new 52-week highs for the INDU and TRAN indexes. We applied a minimum drawdown of at least 10% to precede each buy signal and filtered for signals occurring at least three-months apart.”
The table below shows the Dow Jones Industrial Average ($INDU), the Dow Transports ($TRANS) and the S&P 500 (SPX) average forward returns after a buy signal was registered on July 15. This data measures forward returns after a bull signal confirmation since 1950, and the average returns of all 3 indices after the signal’s 12 months are all 10%.
Chart 3

Source: Bloomberg
Is Dow Theory still relevant?
You may be asking, why is this specific technical indicator still being used since the markets and economy are so much broader now than 100 years ago? The rationale behind Dow’s theory is that “Dow observed in the late 1800s that raw materials and goods would need to be transported via railroads before economic expansion could begin. Subsequently, robust rail activity would typically portend favorable economic conditions for industrial companies.”¹ Today the Dow transportation index is comprised of companies like Old Dominion Freight Line, Union Pacific, Delta Airlines, United Airlines, and Southwest Airlines, FedEx, and UPS. The relevance of today's vast transportation and logistics capabilities to move raw material and consumer goods across the country is more representative of this leading economic indicator.
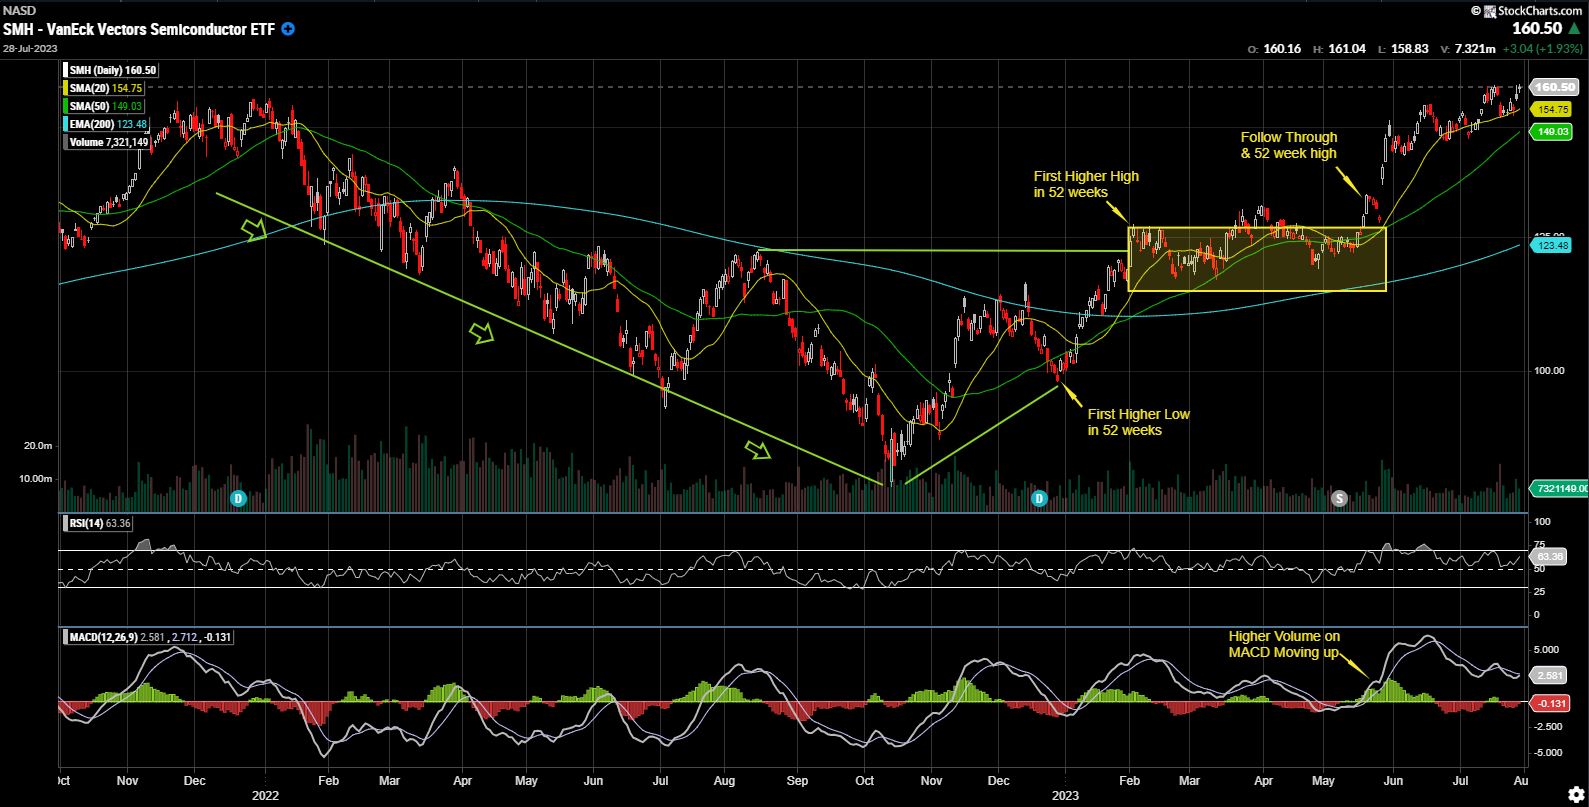
The transportation and INDU are not the only two sectors making similar confirmation signals. Semiconductors are one critical sector for the measurement of raw materials for today’s economy. Below is a chart of the Semiconductor sector ETF (SMH), which one might argue to be a more representative metric for raw materials portion of the technology, automobile and consumer electronic industries. The SMH chart below confirms the bullish market trend and, interestingly enough, started approximately two months prior to the INDU and TRANS charts.
Chart 4

Source: StockCharts.com
Semiconductors have had an early head start due to the craze in artificial intelligence (AI), but they still represent the raw material and components needed for many technology, automobile and consumer-based electronics to operate everyday life. It is difficult to think of an automobile or electronic item that doesn’t require a semiconductor.
It's important to note that Dow Theory is not foolproof and, like any technical analysis tool, it is not immune to false signals or market noise. Investors should use it in conjunction with other indicators and fundamental analysis for a more comprehensive assessment of the market.
This Is Just a Bear Market Rally!
There are many data points to consider when analyzing the markets. The economy’s overall health, the trends of the major indices and investor behavior are all important indicators for current market conditions. Tom Lee, Fundstrat Global Advisors co-founder says, “There has never been a bear market rally that has lasted longer than the previous year’s decline. The market decline of 2022 lasted for 195 days. As of July 26, the upward movement of the broad markets has marked 196 days of this current stock market rally. Which officially creates an asymmetrical bias to the upside for stocks.”
Higher thrusts like our recent 13-day consecutive Dow Jones rally and the expansion of stock participation in the S&P 500 from mid-May through the end of July, tend to happen at the beginning of bull market cycles as opposed to the end.
We have witnessed an expansion in new 52-week highs over the past 45 days in the S&P 500 and NASDAQ. Again, I mentioned the widening of participation beyond the Magnificent 7 stocks, which were mainly fueled by the mega cap tech stocks that were down as much as 75% in 2022. Much of the snapback could have been attributed to technical oversold signals, and also by the fundamental consolidation of corporate balance sheets with the announcement of layoffs by tech firms such as Meta, Microsoft, Google and Amazon.
Many economists at the start of Q1 2023 felt that the U.S. recession was going to start in Silicon Valley, as tech companies started a first round of layoffs followed by a west coast regional banking crisis. Market prognosticators also predicted a 6% slump in Q1 corporate earnings in April and early May. Quite the opposite occurred; these companies became leaner and more efficient, which translated into a much better-than-expected earnings season for Q1 2023. Are we still in a regional banking crisis or could it have been one of the best buying opportunities in 2023? All we can continue to do is make careful and disciplined assessments of market conditions and trends based on the weight of the evidence available.
Whether it’s Dow Theory or any of the numerous disciplines of fundamental or technical analysis that is used, it’s important to know your own personal risk tolerance and time horizon to establish a financial action plan. A well-executed financial plan may help you remain unshakeable for future recessions, bear markets, or moments of high volatility, like many of us witnessed in 2022. Prudent risk management and diversification are crucial aspects for long-term investment success.
Christopher Brown, CIMA®, CRPC™ Vice President- Investments
Important Disclosure Information
This content is general in nature and does not constitute legal, tax, accounting, financial or investment advice. You are encouraged to consult with competent legal, tax, accounting, financial or investment professionals based on your specific circumstances. We do not make any warranties as to accuracy or completeness of this information, do not endorse any third-party companies, products, or services described here, and take no liability for your use of this information. Diversification does not ensure against loss.

