- Share:
-

-

-

-

A macro look ahead
The first quarter of 2023 is in the books and now we are facing the Q1 2023 earnings season with many forecasting the second consecutive quarter of negative year-over-year (YoY) earnings growth — also known as an earnings recession. The earnings contraction of Q4 2022, reported earlier this year, was down -3.2% and forecasters are now projecting a Q1 2023 YoY earnings of -1.6%, the lowest since Q3 of 2020.
Though this earnings season is shaping up to provide a negative print, we are finding that it is still better than expected compared to an earlier forecast in April that predicted a -5.2% for the Q1 2023 earnings season. The big surprise has been the Tech sector, where cost cuts and layoffs of top tech firms provided a better-than-expected earnings season for one of the largest cap weighted sectors of the S&P 500.
Q1 Gross Domestic Product (GDP) rose by 1.1% quarter-over-quarter (QoQ) annualized where personal spending, the biggest GDP component, was up 3.7% — in line with the Atlanta Fed GDP Now Forecast of 4%. This added 248 basis points or approximately 0.25% to GDP with spending on autos and services leading the way. This indicates that we continue to see the U.S. consumer remaining resilient despite the discussed slowdown in savings rates and the M2 Money Supply, which shows a decline in overall money supply over the past four months. M2 is simply the Federal Reserve's estimate of the total money supply including all the cash people have on hand, plus all the money deposited in checking accounts, savings accounts, as well as other short-term saving vehicles such as certificates of deposit (CDs). This has caused concern with economists since it is the fastest slowdown in money supply in 50 years.
Chart 1
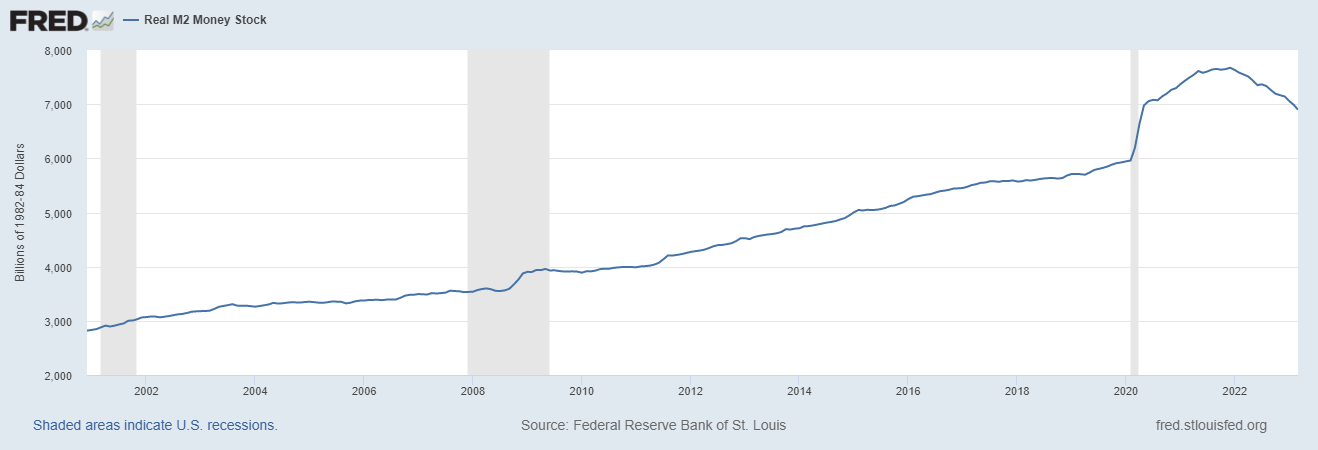
Source: https://fred.stlouisfed.org/series/M2REAL#
The slowdown is likely a reversion to the mean since we have had so much excess money sloshing around the economy. A key component of inflation is when an economy has too much money chasing too few goods and services. This pulls forward demand of these goods and services, which forces businesses to raise prices to curve demand.
Though inflation is normalizing, we are still above the Federal Reserve’s 2% inflation target. Even with the aggressive quantitative tightening (QT) policy, in March of 2022, the Federal Reserve’s stance of the “higher for longer” narrative remains. The Price Consumer Expenditure (PCE) deflator is the metric that the Federal Reserve monitors as its primary benchmark to see if it will keep its foot on the interest rate accelerator or potentially ease off, keeping interest rates elevated as a wait-and-see strategy going forward. The PCE index rose by 4.2% YoY for March 2023. This is the lowest PCE report since May 2021. The March PCE number shows the rising cost of goods and services are normalizing to more manageable levels, but this may still not be enough of a slowdown to create a pause in the Fed’s current QT policy.
Chart 2
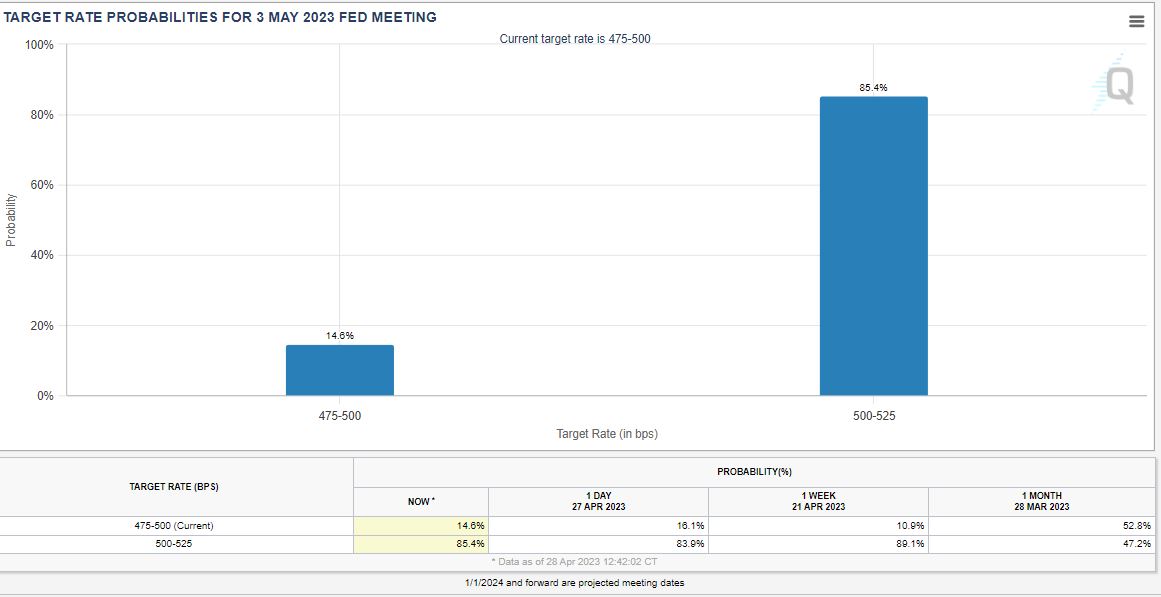
Source: https://www.cmegroup.com/markets/interest-rates/cme-fedwatch-tool.html
The bond market sees a different interest rate environment going forward in the next 12 months. Based on the current yield curve, more than 87% of the treasury yield curve is now inverted with the highest interest rate at this time being the three-month Treasury Bills (T-Bill), at 5.09%, at the time of this writing. The one-year treasury is predicting a Fed cut within the next six to 12 months based on the 40 basis points spread between the six-month and 12-month T-Bills. The inverted yield curve has been one of the heaviest debated topics as a near-term recession indicator over the past six months since the two-year treasury yield dipped and remained below the 10-year treasury yield in early 2022. Essentially, the theory of the inverted yield curve and its relationship to a recession indicates that near-term interest rates are higher than longer-term interest rates; this infers that future economic growth will be lower than current economic growth conditions.
 The current macro conditions should be a three-part story — the first of which started in 2022; a bear market in stocks and bonds.
Currently, the three-month T-Bill is just over 5% while the 10-year treasury is currently at 3.53%. This is the deepest inversion from three months and 10 years in market history. This poses the question: does the bond market have it right? Historically, when the three-month treasury yield and the 10-year treasury yields are inverted, a recession has followed within 24 months. This particular yield curve inversion transpired in 2007, 2000, and 1989, with a U.S. recession that followed. Below is the Federal Reserve Economic Data (FRED) chart provided by the St. Louis Federal Reserve that shows the dip below the zero line (where the inversion occurs) and the gray bars (where the recession followed).
Chart 3
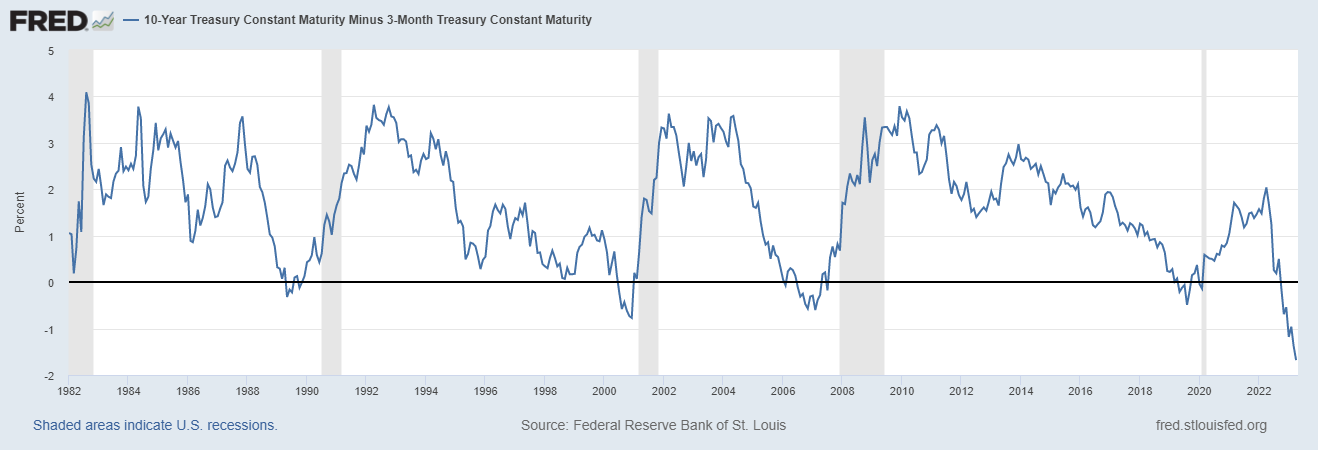
Source: https://fred.stlouisfed.org/series/T10Y3M#
Before you go running to buy gold bars and burying your cash in the backyard, perhaps you should consider the fact that all economic recessions are not equal. Sometimes recessions can be mild, like 1994, and some recessions can be ugly in causing financial destruction in its wake, like the global financial crisis of 2008. The current macro conditions should be a three-part story — the first of which started in 2022; a bear market in stocks and bonds. From the S&P 500 January 2022 peak to the market troughs of October 2022, the S&P 500 fell -26% and the NASDAQ fell a little more than -35%. A 20% downside move in the markets defines the bear market of 2022, which serves as the first part of our three-part economic story.
Technically, we are still within this bear market since we have not taken out our previous January 2022 high. Though market conditions have improved over the past four months, there is still a chance that parts of the market may retest the October 2022 lows. The second part of the story is an earnings recession, which we are amid currently. An earnings recession is defined as two consecutive quarters with negative earnings growth. As listed above, we already know that forecasting has its limitations where many had forecasted a -5.2% earnings growth for Q1 2023. With more than 70% of the earnings reported, this negative earnings projection has been revised down to -1.6%.
The important question is: what does the market do if we go into an earnings recession and eventually slide into part three, an economic recession? If we do back-of-the-napkin math and just look at the S&P 500 earnings per share (EPS) and how it would price in a recession by its market multiple, we will first look at earnings — the S&P 500 EPS as of Q4 2022 was approximately $218.00. Currently the S&P 500 is trading around 4,150, so a $218 earnings per share (EPS) would mean that the S&P currently trades at a 19X-forward multiple (i.e., 4150/$218.00= 19.03). Nineteen-times earnings is not necessarily a bargain in the stock market, but it is also not an overblown valuation.
If we were to get an earnings slowdown of 5% for 2023, which many forecasters are anticipating, that would bring the S&P 500 EPS to $207.10. During recessionary market environments that average P/E multiple of the S&P 500 is approximately 14 ($207.10 X 14= 2899.40). Could this be a moderate economic recession where unemployment goes above 5% and interest rates rapidly drop with the Fed starting a series of rate cuts going forward? Also, historically the S&P 500 will usually pull back approximately 30% from peak to trough. From the S&P 4,400 high in January 2022, a total draw down of 30% would be S&P 3,080.
The severity of a corporate earnings recession and eventual economic recession can be exacerbated by a looming credit crunch as the Fed keeps a stiff upper lip on interest rates. There is also a good chance we may experience a relatively mild earnings recession due to consumer strength, falling inflation and low unemployment. The Conference Board for Economic Indicators published its index of recessionary probabilities by its measurements of leading, coincidental and lagging economic indicators.
Chart 4
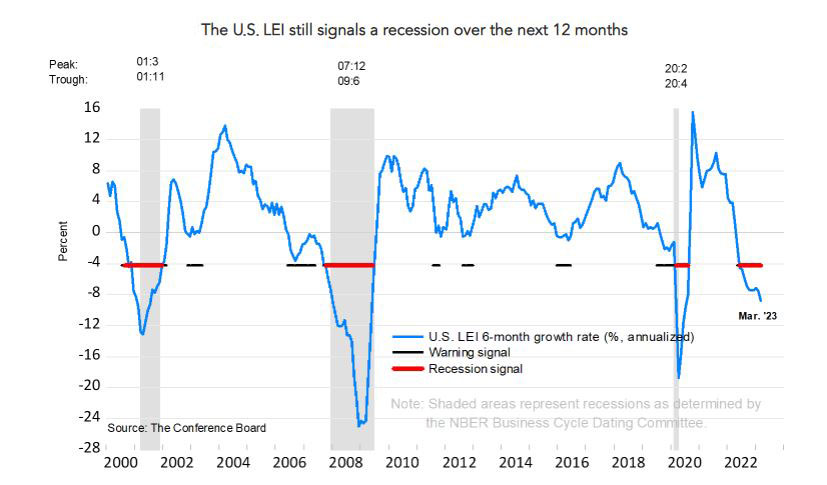
Source: https://www.conference-board.org/topics/us-leading-indicators
We may avoid a recession this year as we chop sideways until the market eventually creates a downturn due to weakening economic conditions. All sectors of the market may not experience the same volatility in the near future but retesting the October 2022 lows may not be out of the question for the broad markets in 2023. The market is not the economy, and the economy is not the market. In fact, historically the markets tend to bottom and recover while the economy is still within recessionary conditions.
As discussed in previous market updates, knowing your risk tolerance and diversification of your investment holdings will be a key attribute to navigating future volatility and staying invested. Creating a financial plan to identify your investment objectives and investment time horizon will be the best way to establish a proper investment plan to navigate choppy market conditions. What’s more, reviewing your investment plan with a financial professional may help provide insight on an appropriate investment strategy for your long-term goals.
Chris Brown, Vice President — Investments, Synovus Securities, Inc.
Important Disclosure Information
This content is general in nature and does not constitute legal, tax, accounting, financial or investment advice. You are encouraged to consult with competent legal, tax, accounting, financial or investment professionals based on your specific circumstances. We do not make any warranties as to accuracy or completeness of this information, do not endorse any third-party companies, products, or services described here, and take no liability for your use of this information. Diversification does not ensure against loss.