Currency Outlook: Third Quarter 2023
Last month, the Fed decided to pause interest rate hikes, which was mostly expected. Since then, we have seen lower inflation numbers this week (June 26) plus good U.S. employment numbers the week of June 19. However, the Fed did announce two more hikes this year, including one in July, that would put Fed Funds at around 5.6%. After a month and a half of U.S. dollar strength, there are signs that it is about to return to a weakening trend.
EUR/USD (Bullish)
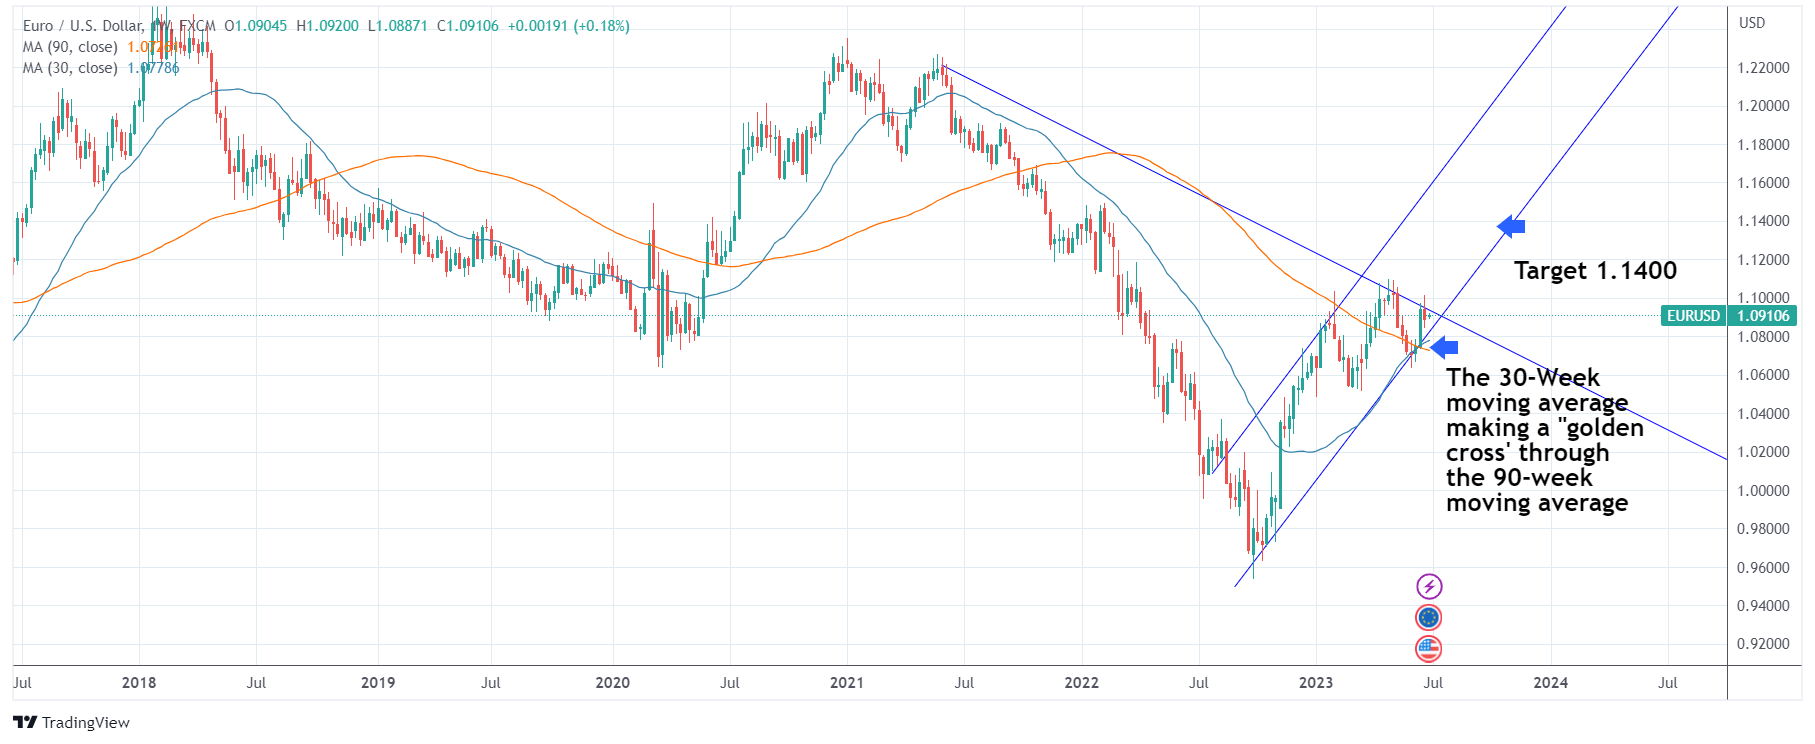
The euro and U.S. dollar (EUR/USD) formed a golden cross, where the 30-week moving average crosses through the 90-week moving average, which is usually a strong signal for a longer term trend. The weekly chart had a bullish candle the second week of June, which may mean a short-term move through key 1.1100 resitance, targeting a move to 1.1400.
The European Central Bank raised interest rates 25 basis points (BPS) to 3.5%. Inflation has been cooling but still remained stubbornly high in May at 6.1%. Projections are for inflation to be above the 2% target into 2025. The Eurozone had some soft numbers after the rate hike, which is leading the markets to believe a pause in rates may come at end of the year. However, European Central Bank (ECB) President Christine Lagarde gave no hints to slowing down, adding, “We are not thinking about pausing. Are we done? Have we finished the journey? No, we are not at [the] destination.”
As the ECB diverges from the U.S. on hikes and headline inflation higher in the Eurozone, expectations are for the EUR to outpace the dollar. If the economy shows signs of cooling, we could see the ECB follow the Fed by pausing hikes, which would have EUR/USD range bound by year end.
EUR/USD chart

Source: TradingView.com
GBP/USD (Bullish)
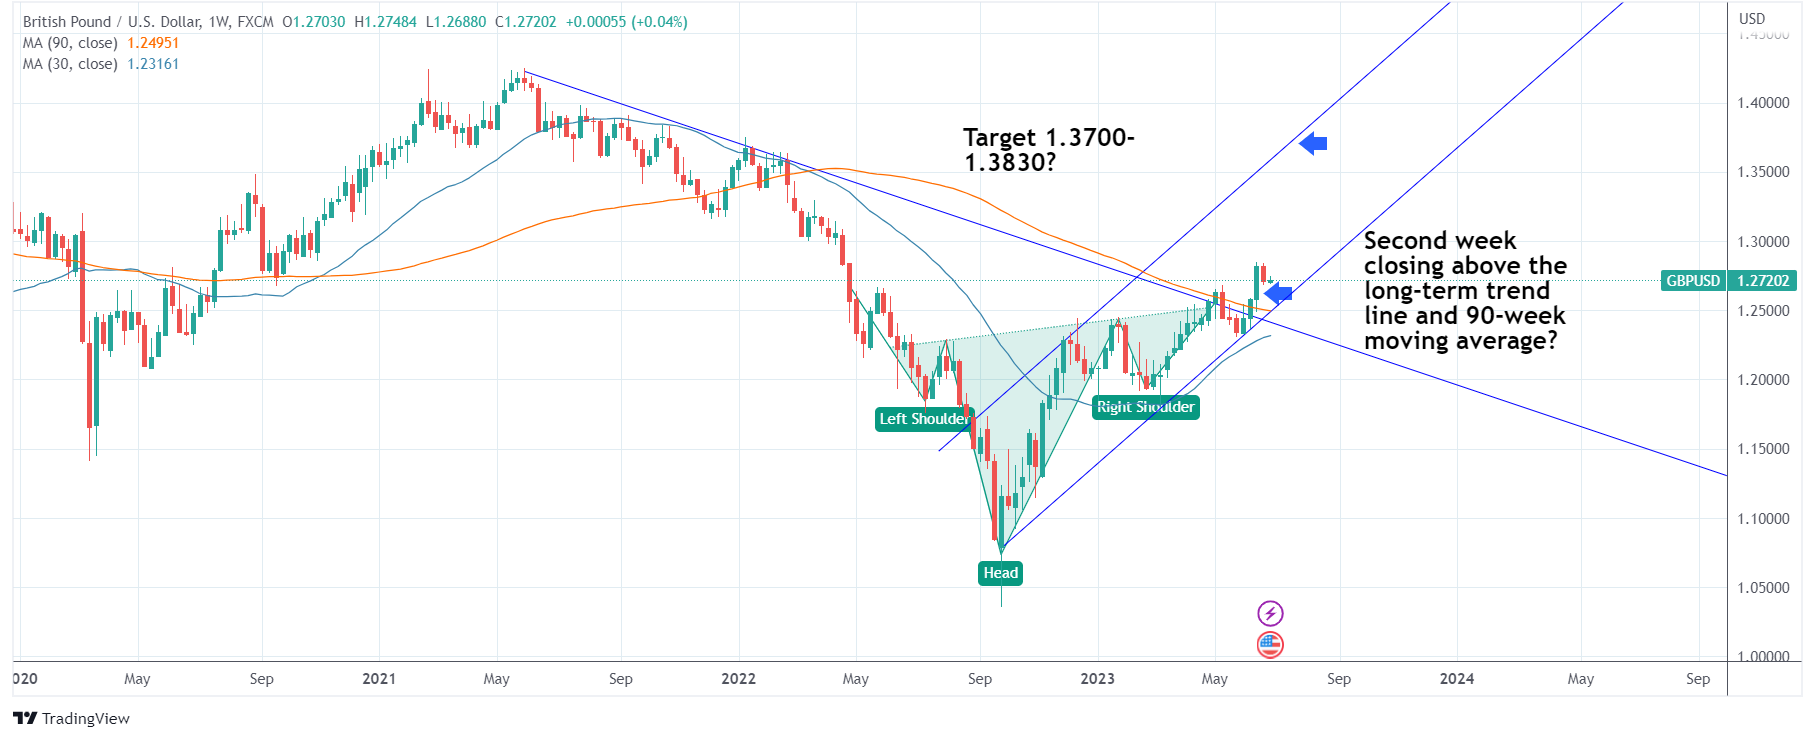
The British pound and U.S. dollar (GBP/USD) has been in an uptrend since October 2022. It retraced from the 1.03 area to 1.24, a 20% increase by January. In April, it formed a reverse head and shoulders pattern, which is usually a setup for a much larger move higher. The U.S. debt ceiling issue put the upward move on pause for six weeks. Now that the debt ceiling is behind the markets, from a technical standpoint it appears that GBP is poised for a much larger move higher. GBP/USD made a weekly close in June above not only the neckline of the head and shoulders, but a close above the long-term down trend line and the 90 period moving average. This could target 1.32 short term and possibly 1.3830 into the year’s end. From a macro standpoint, the United Kingdom (UK) has more sticky inflation issues due to supply chain, energy and Brexit. This will keep the Bank of England vigilant on hiking rates while the U.S. is winding down. The Bank of England, one of the first of the G-7 countries to raise rates, and surpised economists with a 50 bps hike in June, raising rates for the 13th straight consecutive meeting.
“We know this is hard,” said the Bank of England Governor Andrew Bailey. “Many people with mortgages or loans will be understandably worried about what this means for them. But if we don’t raise rates now, it could be worse later.”
England faces a cost-of-living crisis exceeding the U.S. due to higher energy and food bills. As traders push up yields on higher interest rate bets, GBP/USD will continue to move higher into 2024.
GBP/USD chart

Source: TradingView.com
USDJPY (Bullish)
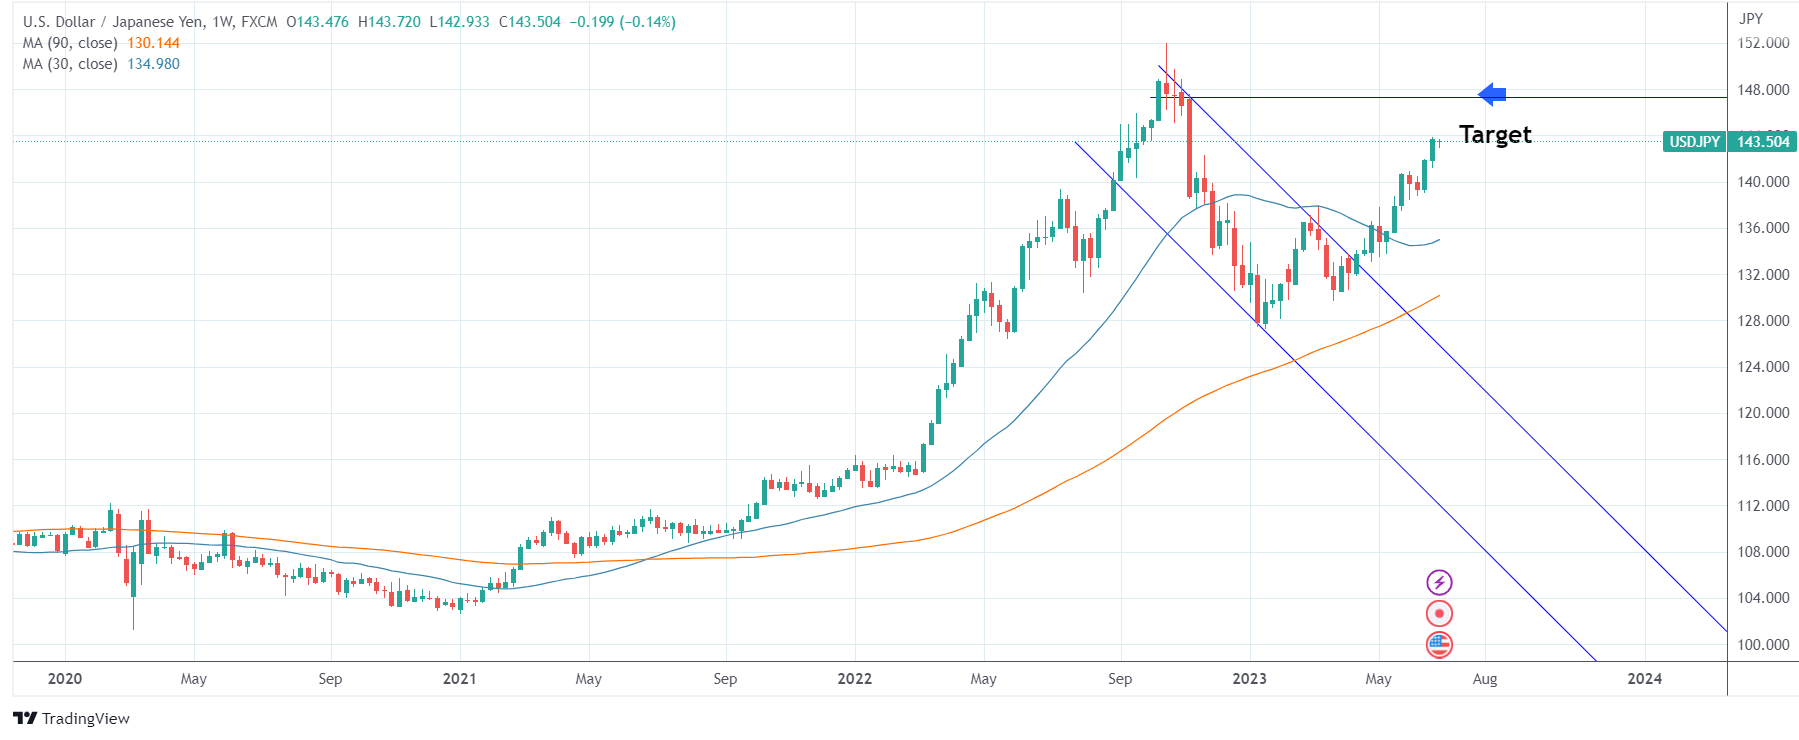
The yen and U.S. dollar (USD/JPY) is one of the only positive dollar stories right now. As of this writing, the pair is pushing 143 and could quickly move to 147. The Fed has called for two more hikes this year, so with Japan still essentially at zero interest rates, the USD has room to move up. The move has not been as dramatic as GBP/JPY and EUR/JPY, both of which have made considerable progress higher. GBP/JPY is at its highest since 2015 Brexit levels and EUR/JPY is at pre-Great Recession levels. Inflation has remained low in Japan and is expected to fall below 2% later this year. The Bank of Japan struggled to define rate policy in its last meeting in April under a new governor. If wages do not exceed projections, the Bank of Japan will keep ultra-easy policy and G-7 currencies should remain strong vs JPY.
USD/JPY chart

Source: TradingView.com
USD/CAD (Bearish)
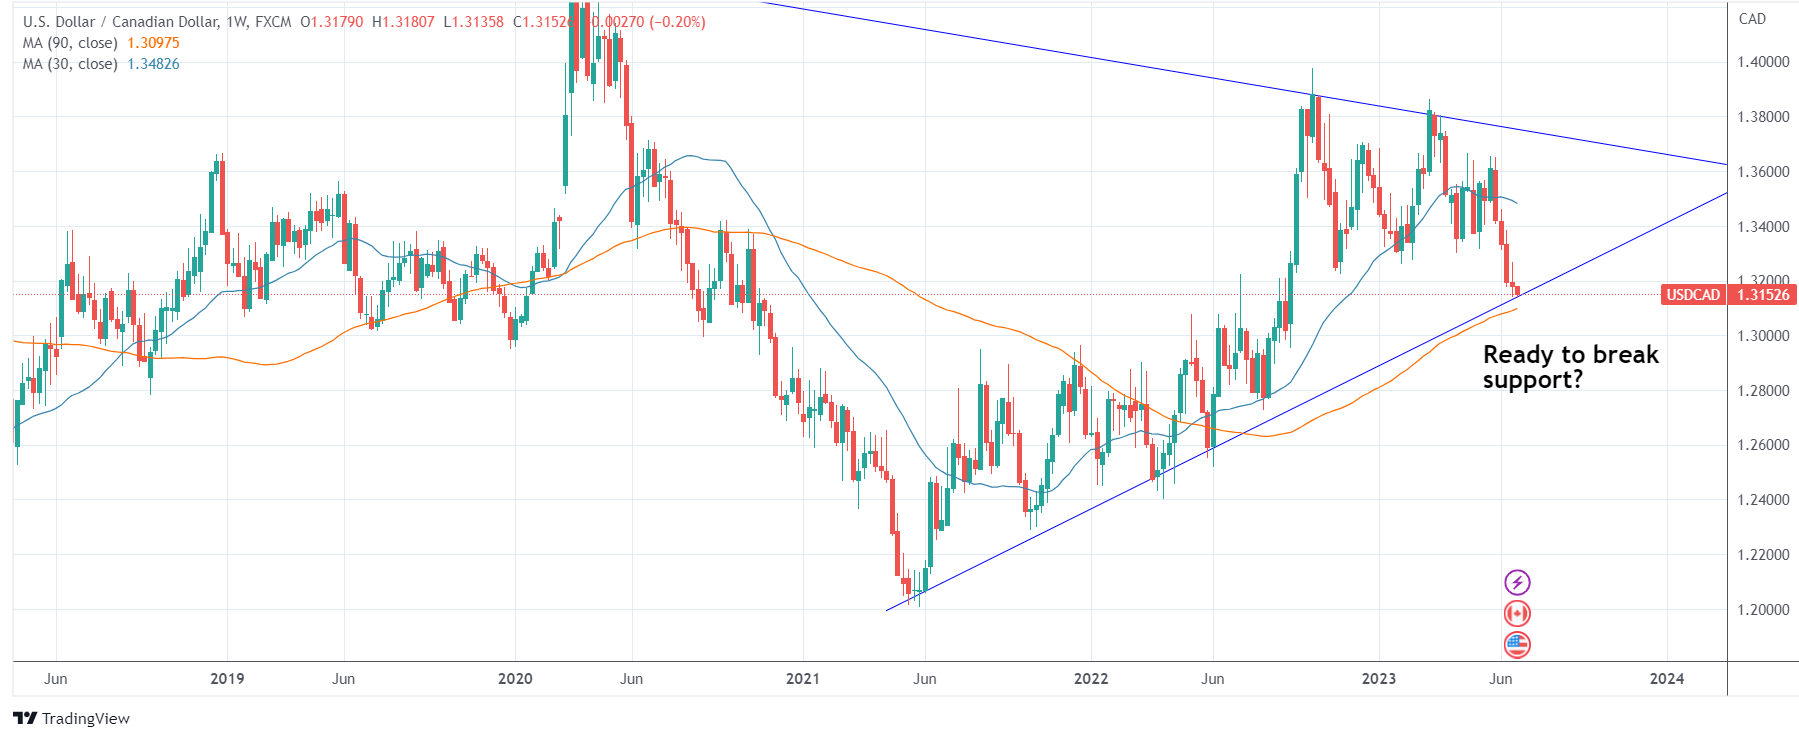
As economic data continues to come in hotter than expected, the Bank of Canada (BoC) hiked rates to 4.75%, the highest since 2001. The BoC comtemplated a pausing rates a similar fashion as the the Federal Open Market Committee (FOMC). Although inflation ticked higher, consumer spending remains strong, and oil demand — Canada’s main commodity — continues to be the economy’s revenue engine. From a technical stand point, USD/CAD has turned to the lowest point since September 2022. Higher oil prices usually correlate with a strong Canadian dollar. Oil has been trending down since March 2022 but appears to be forming a base. USD/CAD is now pushing into long-term support dating to 2021, and we could see a deeper move lower if a global recession gets pushed into 2024.
USD/CAD chart

Source: TradingView.com
David J. Grimaldi, TM Foreign Exchange Sales Consultant
Important Disclosure Information
This content is general in nature and does not constitute legal, tax, accounting, financial or investment advice. You are encouraged to consult with competent legal, tax, accounting, financial or investment professionals based on your specific circumstances. We do not make any warranties as to accuracy or completeness of this information, do not endorse any third-party companies, products, or services described here, and take no liability for your use of this information. Diversification does not ensure against loss.

