Synovus Environmental Management
Doing Our Part
We’re focused on the future—becoming the bank we’ve always been, but better. And we’re also wholly committed to fulfilling our purpose by enabling team members, clients, shareholders and communities to reach their full potential.
As we work to build the better bank of tomorrow, we believe that protecting the environment is critical to the health and well-being of the people and communities we serve.
2023 Highlights and 2024 Steps to Positively Impact the Environment
In 2023, we continued to assess our environmental impact. We reduced workspace square footage by nearly 40,000 square feet. This work has contributed to the overall decrease in Scope and impacted our stationary combustion emissions. We recognize the need to assess potential environmental impacts and have defined our priorities for 2024.
Our 2024 priorities include the following:
- Continue physical space reductions.
- Continue digital banking adoption.
- Increase accessibility to electric vehicle charging stations.
- Continue exploration of and engagement in solar tax credits.
- Advance our renewable energy lending offerings.
- Assess, prioritize and address risks.
Understanding our Greenhouse Gas Emissions
Our Approach to Calculating Emissions
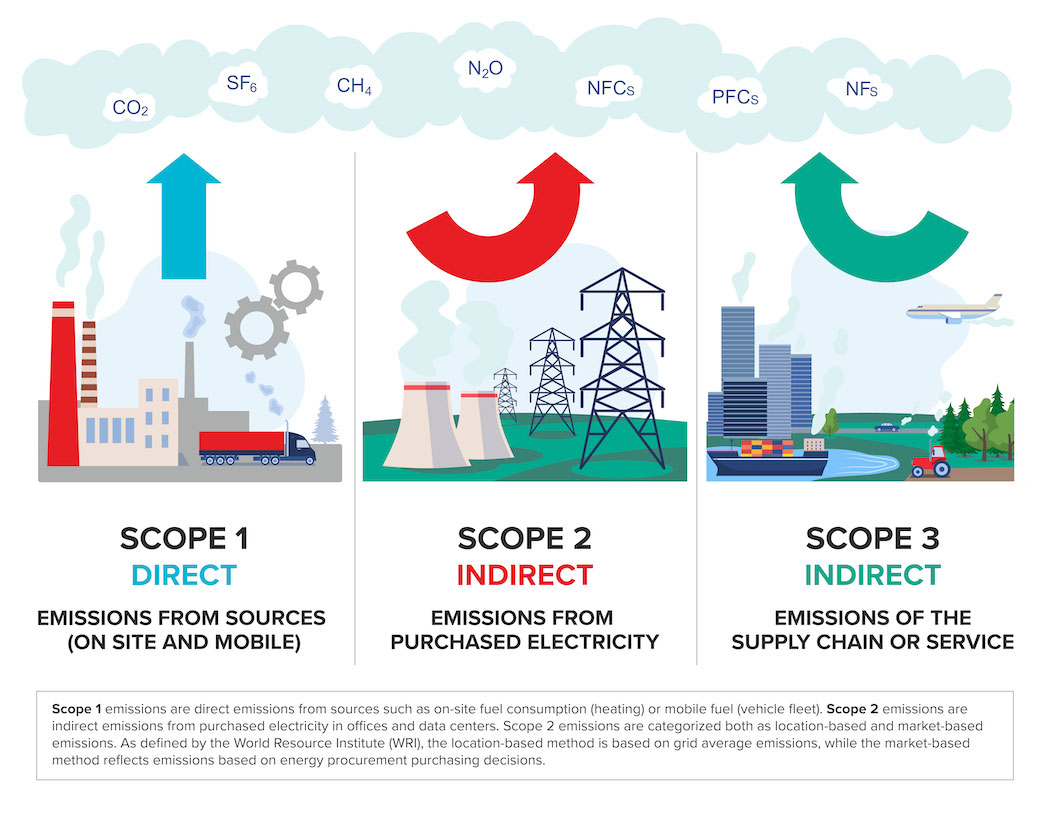
We calculated Scope 1 and Scope 2 location- and market-based GHG emissions based on available data for each calendar year using a methodology consistent with the World Resource Institute’s (WRI) GHG Protocol Corporate Accounting and Reporting Standard.
| Synovus’ Vehicle Fleet & Aircraft | 2019 | 2020 | 2021 | 2022 | 2023 |
| Vehicle and Fleet Gasoline Usage | 44,725 gallons | 44,725 gallons | 43,277 gallons | 47,263 gallons | 58,688 gallons |
| Aircraft Jet Fuel Usage | 154,952 gallons | 39,168 gallons | 122,497 gallons | 149,393 gallons | 114,817 gallons |
Based on this methodology, we calculated our GHG emissions for 2019 - 2023:
| Summary of 2019-2023 Synovus Scope 1 and Scope 2 Emissions | Emissions in mtCO2e(1) | ||||
| Emissions Categories | 2019 | 2020 | 2021 | 2022 | 2023 |
| Scope 1 Emissions (Stationary Combustion) | 598 | 598 | 595 | 426 | 418 |
| Scope 1 Emissions (Mobile Sources) | 1,916 | 778 | 1,585 | 1,885 | 1,636 |
| Scope 1 Emissions (Fugitive Sources) | excluded | excluded | excluded | 1,258 | 1,157 |
| Total Scope 1 Emissions | 2,514 | 1,376 | 2,180 | 3,569 | 3,210 |
|
|
|
|
|
|
|
| Location-Based Scope 2 Emissions | 22,974 | 22,941 | 21,144 | 19,652 | 18,560 |
| Market-Based Scope 2 Emissions | 23,122 | 23,088 | 23,684 | 19,759 | 18,794 |
| Total Scope 1 & Location-Based Scope 2 Emissions | 25,488 | 24,317 | 23,324 | 23,222 | 21,770 |
| Total Scope 1 & Market-Based Scope 2 Emissions | 25,636 | 24,464 | 25,864 | 23,328 | 22,004 |
(1) Metric Tons of Carbon Dioxide Equivalent
Energy Management
In understanding our emissions, we realize there are two primary focus areas for our energy management: the physical infrastructure of our offices and branches and the energy consumed by our technology and data centers. The Synovus team has made strides to increase efficiency and draw down energy usage in both areas.
Energy-efficient Infrastructure
Operational emissions related to buildings, including heating, cooling and lighting, account for 28% of all carbon emissions in the world. Synovus has approximately 247 branches and offices in the southeast region of the U.S. – 41% of which are fitted with LED lighting to conserve electricity.
We conduct annual energy audits to identify energy reduction opportunities within our buildings. In select locations, we monitor energy use and benchmark performance against equivalent buildings in size and function. When consumption exceeds its normal range, we perform testing and root cause analysis to identify sources of excess use.
While all buildings are weighted equally in our consideration of energy upgrades, adopting energy-efficient measures is easier and more economical when constructing new buildings. We’ve installed approximately 12 electronic vehicle (EV) charging stations as of December 31, 2023. We’ve also increased the use of LED lighting to approximately 41% of our offices, up 2% year over year. We’re excited to continue improving the energy efficiency of our infrastructure.
| Synovus' Facilities Natural Gas Consumption | ||||
| 2019 | 2020 | 2021 | 2022 | 2023 |
| 112,609 Therms | 112,609 Therms | 112,153 Therms | 80,232 Therms | 78,615 Therms |
| Synovus' Facilities Electricity Consumption | ||||
| 2019 | 2020 | 2021 | 2022 | 2023 |
| 54,028 MWh | 54,060 MWh | 55,479 MWh | 51,659 MWh | 47,320 MWh |
| Synovus' Water Consumption (in thousands) |
| 2023 |
| 30,918 gallons |
Over the past few years, we’ve strategically right-sized our operational footprint with significant reductions in our real estate as measured in square footage, as noted in the table below:
| Real Estate Square Footage (Total) | ||
| 2021 | 2022 | 2023 |
| 2,999M | 2,653M | 2,616M |
We’re working to reduce our energy footprint by upgrading our hardware technology, with the deployment of new laptops to replace more energy-intensive desktop computers. Old equipment is wiped of all data and decommissioned. We work with a third-party recycling vendor to collect and properly recycle used electronic equipment.
We’re consolidating servers located across our branches to cloud servers. By transitioning fully to the cloud, we anticipate reducing our reliance on computer data centers that operate using nonrenewable electricity sources.
Transitioning to Digital Communications
Banking has traditionally been a paper-intensive industry. However, that is changing rapidly as banks adopt electronic transactions and record-keeping, make operational improvements away from paper and transition clients to electronic statements.
Recycling bins are distributed in select locations, and team members are encouraged to actively recycle individual waste in accordance with local recycling guidelines.
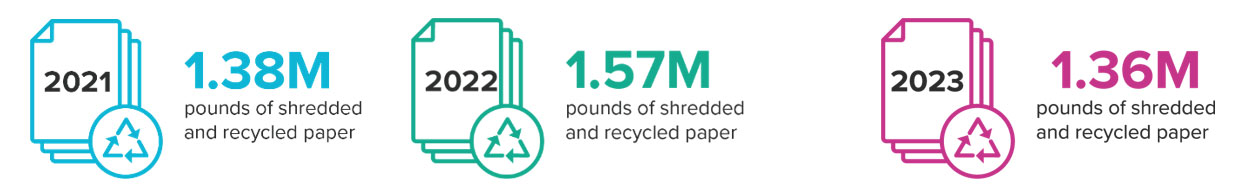
Several factors contributed to a reduction in paper use. Internal communications are predominantly electronic, with minimal printed collateral or supporting materials, and we’ve implemented additional digital channels to shift from paper-based communication across the company. Default printer settings are for double-sided printing in black and white. Scanning documents to electronic formats, process improvements and remote working have yielded a decrease in total pages printed. To protect private and confidential information, we shred and recycle our used paper through a third-party collection agency. During 2023, Synovus securely shredded and recycled more than 1.36 million pounds of paper. This paper is taken to paper mills for pulping for use in other supply chains, contributing to a more circular economy.